|
Download Data (XLS File) |
|
||||||||
|
||||||||
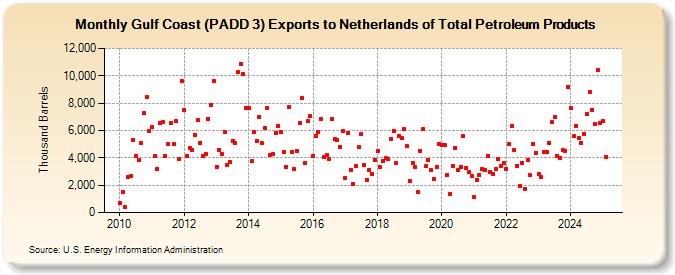
| Gulf Coast (PADD 3) Exports to Netherlands of Total Petroleum Products (Thousand Barrels) | ||||||||
| Year | Jan | Feb | Mar | Apr | May | Jun | Jul | Aug | Sep | Oct | Nov | Dec |
|---|---|---|---|---|---|---|---|---|---|---|---|---|
| 2010 | 680 | 1,539 | 422 | 2,631 | 2,700 | 5,298 | 4,132 | 3,815 | 5,088 | 7,255 | 8,447 | 5,996 |
| 2011 | 6,290 | 4,164 | 3,207 | 6,541 | 6,595 | 4,146 | 4,981 | 6,537 | 5,027 | 6,686 | 3,905 | 9,628 |
| 2012 | 7,532 | 4,162 | 4,701 | 4,601 | 5,703 | 6,760 | 5,097 | 4,164 | 4,273 | 6,863 | 7,834 | 9,634 |
| 2013 | 3,332 | 4,590 | 4,264 | 5,882 | 3,463 | 3,719 | 5,244 | 5,092 | 10,303 | 10,872 | 10,142 | 7,638 |
| 2014 | 7,657 | 3,759 | 5,879 | 5,210 | 6,969 | 5,074 | 6,186 | 7,665 | 4,222 | 4,268 | 5,847 | 6,352 |
| 2015 | 5,919 | 4,451 | 3,356 | 7,703 | 4,412 | 3,172 | 4,533 | 6,565 | 8,368 | 3,607 | 6,675 | 7,061 |
| 2016 | 4,133 | 5,563 | 5,885 | 6,862 | 4,082 | 4,182 | 3,896 | 6,864 | 5,354 | 5,281 | 4,788 | 5,933 |
| 2017 | 2,552 | 5,794 | 3,144 | 2,090 | 3,375 | 4,783 | 5,756 | 3,459 | 2,380 | 3,116 | 2,817 | 3,862 |
| 2018 | 4,475 | 3,303 | 3,740 | 3,963 | 3,896 | 5,403 | 5,980 | 3,603 | 5,587 | 5,447 | 6,102 | 4,836 |
| 2019 | 2,287 | 3,629 | 3,299 | 1,510 | 4,523 | 6,094 | 3,419 | 3,833 | 3,095 | 2,463 | 3,294 | 4,984 |
| 2020 | 4,905 | 4,937 | 2,765 | 1,355 | 3,426 | 4,735 | 3,095 | 3,294 | 5,581 | 3,282 | 2,937 | 2,649 |
| 2021 | 1,112 | 2,413 | 2,756 | 3,199 | 3,146 | 4,153 | 2,972 | 2,845 | 3,171 | 3,905 | 3,400 | 3,637 |
| 2022 | 3,210 | 5,028 | 6,344 | 4,570 | 3,397 | 1,958 | 3,657 | 1,733 | 3,863 | 2,763 | 5,012 | 4,332 |
| 2023 | 3,111 | 2,315 | 4,737 | 5,255 | 4,862 | 6,772 | 6,229 | 3,827 | 4,276 | 4,539 | 4,515 | 9,155 |
| 2024 | 7,652 | 5,572 | 6,339 | 5,482 | ||||||||
| - = No Data Reported; -- = Not Applicable; NA = Not Available; W = Withheld to avoid disclosure of individual company data. |
| Release Date: 6/28/2024 |
| Next Release Date: 7/31/2024 |