|
Download Data (XLS File) |
|
||||||||
|
||||||||
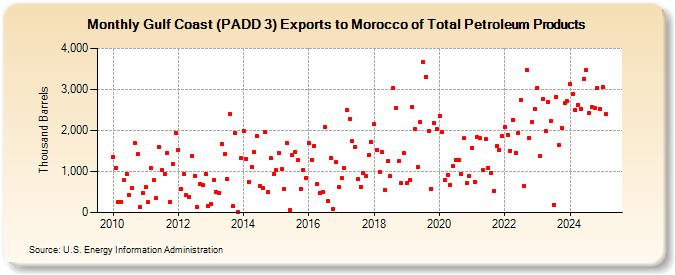
| Gulf Coast (PADD 3) Exports to Morocco of Total Petroleum Products (Thousand Barrels) | ||||||||
| Year | Jan | Feb | Mar | Apr | May | Jun | Jul | Aug | Sep | Oct | Nov | Dec |
|---|---|---|---|---|---|---|---|---|---|---|---|---|
| 2010 | 1,354 | 1,087 | 248 | 264 | 784 | 936 | 422 | 598 | 1,698 | 1,430 | 138 | 477 |
| 2011 | 621 | 248 | 1,081 | 785 | 345 | 1,593 | 1,043 | 950 | 1,453 | 266 | 1,187 | 1,939 |
| 2012 | 1,535 | 562 | 934 | 428 | 387 | 1,376 | 894 | 130 | 697 | 670 | 944 | 165 |
| 2013 | 200 | 795 | 511 | 476 | 1,671 | 1,422 | 823 | 2,402 | 149 | 1,939 | 6 | 1,319 |
| 2014 | 1,996 | 1,315 | 753 | 1,107 | 1,481 | 1,857 | 648 | 598 | 1,952 | 495 | 1,318 | 942 |
| 2015 | 1,039 | 1,463 | 1,059 | 564 | 1,689 | 55 | 1,393 | 1,476 | 1,286 | 582 | 1,040 | 851 |
| 2016 | 1,706 | 1,292 | 1,621 | 698 | 469 | 507 | 2,074 | 276 | 1,326 | 85 | 1,230 | 621 |
| 2017 | 839 | 1,090 | 2,502 | 2,283 | 1,734 | 1,609 | 808 | 633 | 967 | 896 | 1,409 | 1,713 |
| 2018 | 2,151 | 1,533 | 988 | 1,474 | 556 | 1,246 | 897 | 3,037 | 2,551 | 1,268 | 716 | 1,442 |
| 2019 | 712 | 792 | 2,584 | 2,044 | 1,106 | 2,216 | 3,672 | 3,313 | 1,989 | 580 | 2,182 | 2,030 |
| 2020 | 2,362 | 1,970 | 803 | 927 | 674 | 1,138 | 1,286 | 1,289 | 944 | 1,805 | 720 | 896 |
| 2021 | 1,585 | 739 | 1,832 | 1,815 | 1,036 | 1,792 | 1,088 | 976 | 526 | 1,616 | 1,530 | 1,855 |
| 2022 | 2,090 | 1,900 | 1,506 | 2,266 | 1,457 | 1,940 | 2,736 | 652 | 3,484 | 1,821 | 2,218 | 2,519 |
| 2023 | 2,871 | 1,906 | 2,116 | 1,978 | 2,509 | 2,225 | 252 | 2,823 | 1,637 | 2,068 | 2,660 | 2,417 |
| 2024 | 3,134 | |||||||||||
| - = No Data Reported; -- = Not Applicable; NA = Not Available; W = Withheld to avoid disclosure of individual company data. |
| Release Date: 3/29/2024 |
| Next Release Date: 4/30/2024 |