|
Download Data (XLS File) |
|
||||||||
|
||||||||
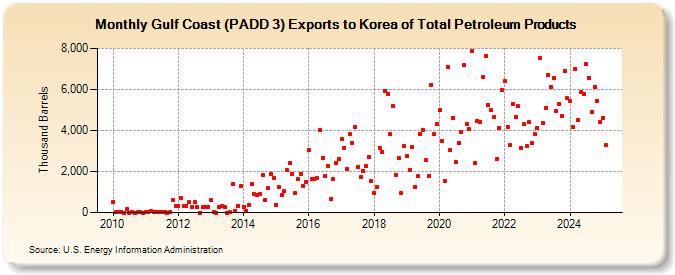
| Gulf Coast (PADD 3) Exports to Korea of Total Petroleum Products (Thousand Barrels) | ||||||||
| Year | Jan | Feb | Mar | Apr | May | Jun | Jul | Aug | Sep | Oct | Nov | Dec |
|---|---|---|---|---|---|---|---|---|---|---|---|---|
| 2010 | 500 | 8 | 20 | 28 | 0 | 197 | 0 | 39 | 2 | 24 | 13 | 0 |
| 2011 | 5 | 13 | 79 | 27 | 15 | 20 | 7 | 15 | 2 | 7 | 588 | 344 |
| 2012 | 326 | 724 | 321 | 311 | 514 | 273 | 533 | 263 | 1 | 268 | 268 | 281 |
| 2013 | 595 | 14 | 1 | 276 | 296 | 271 | 1 | 4 | 1,370 | 88 | 334 | 1,310 |
| 2014 | 288 | 89 | 365 | 1,377 | 903 | 847 | 900 | 1,811 | 598 | 1,193 | 1,888 | 1,678 |
| 2015 | 385 | 1,231 | 832 | 1,045 | 2,061 | 2,405 | 1,884 | 930 | 1,632 | 1,900 | 1,290 | 1,509 |
| 2016 | 3,032 | 1,634 | 1,636 | 1,695 | 4,011 | 2,649 | 1,801 | 2,281 | 644 | 1,618 | 2,407 | 2,598 |
| 2017 | 3,586 | 3,161 | 2,143 | 3,839 | 3,388 | 4,192 | 2,239 | 1,714 | 2,040 | 2,255 | 2,686 | 1,552 |
| 2018 | 937 | 1,251 | 3,166 | 2,973 | 5,926 | 5,795 | 3,812 | 5,179 | 1,854 | 2,659 | 961 | 3,250 |
| 2019 | 2,751 | 2,071 | 3,183 | 1,265 | 1,768 | 3,804 | 4,044 | 2,553 | 1,782 | 6,236 | 3,815 | 4,301 |
| 2020 | 4,984 | 3,477 | 1,536 | 7,098 | 3,047 | 4,616 | 2,440 | 3,385 | 3,923 | 7,201 | 4,324 | 4,049 |
| 2021 | 7,890 | 2,398 | 4,483 | 4,425 | 6,601 | 7,637 | 5,219 | 4,989 | 4,666 | 2,589 | 4,124 | 5,979 |
| 2022 | 6,395 | 4,184 | 3,292 | 5,313 | 4,663 | 5,171 | 3,137 | 4,292 | 3,248 | 4,390 | 3,376 | 3,842 |
| 2023 | 2,992 | 6,860 | 3,227 | 5,011 | 6,411 | 5,352 | 5,183 | 3,731 | 4,381 | 3,716 | 5,203 | 5,602 |
| 2024 | 5,444 | |||||||||||
| - = No Data Reported; -- = Not Applicable; NA = Not Available; W = Withheld to avoid disclosure of individual company data. |
| Release Date: 3/29/2024 |
| Next Release Date: 4/30/2024 |