|
Download Data (XLS File) |
|
||||||||
|
||||||||
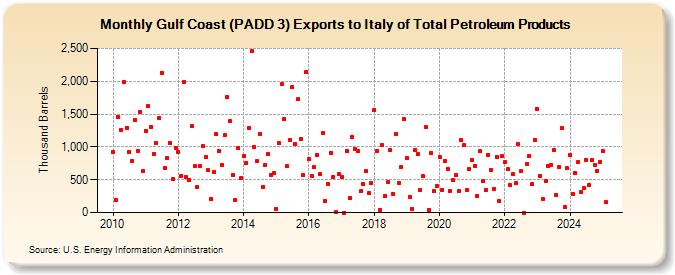
| Gulf Coast (PADD 3) Exports to Italy of Total Petroleum Products (Thousand Barrels) | ||||||||
| Year | Jan | Feb | Mar | Apr | May | Jun | Jul | Aug | Sep | Oct | Nov | Dec |
|---|---|---|---|---|---|---|---|---|---|---|---|---|
| 2010 | 929 | 190 | 1,460 | 1,261 | 1,986 | 1,293 | 921 | 784 | 1,413 | 934 | 1,532 | 632 |
| 2011 | 1,249 | 1,624 | 1,308 | 899 | 1,066 | 1,444 | 2,130 | 676 | 834 | 1,066 | 507 | 981 |
| 2012 | 923 | 556 | 1,994 | 541 | 503 | 1,318 | 715 | 386 | 711 | 1,011 | 840 | 641 |
| 2013 | 212 | 617 | 1,191 | 945 | 719 | 1,177 | 1,756 | 1,388 | 578 | 195 | 979 | 521 |
| 2014 | 858 | 759 | 1,291 | 2,467 | 1,001 | 778 | 1,198 | 393 | 731 | 898 | 577 | 602 |
| 2015 | 58 | 1,052 | 1,951 | 1,431 | 702 | 1,107 | 1,915 | 1,038 | 1,724 | 1,117 | 571 | 2,144 |
| 2016 | 815 | 561 | 693 | 876 | 584 | 1,209 | 175 | 440 | 912 | 540 | 11 | 592 |
| 2017 | 543 | 0 | 945 | 229 | 1,152 | 968 | 941 | 322 | 430 | 628 | 300 | 451 |
| 2018 | 1,561 | 940 | 34 | 1,026 | 251 | 461 | 951 | 286 | 1,197 | 456 | 693 | 1,432 |
| 2019 | 833 | 238 | 59 | 959 | 891 | 340 | 552 | 1,306 | 32 | 912 | 326 | 405 |
| 2020 | 852 | 350 | 779 | 659 | 326 | 490 | 565 | 322 | 1,099 | 1,028 | 337 | 657 |
| 2021 | 796 | 713 | 251 | 932 | 475 | 342 | 874 | 646 | 362 | 847 | 172 | 861 |
| 2022 | 763 | 659 | 415 | 580 | 446 | 1,042 | 634 | 0 | 737 | 855 | 428 | 1,112 |
| 2023 | 1,576 | 581 | 246 | 481 | 998 | 726 | 950 | 273 | 695 | 1,334 | 78 | 671 |
| 2024 | 874 | |||||||||||
| - = No Data Reported; -- = Not Applicable; NA = Not Available; W = Withheld to avoid disclosure of individual company data. |
| Release Date: 3/29/2024 |
| Next Release Date: 4/30/2024 |