|
Download Data (XLS File) |
|
||||||||
|
||||||||
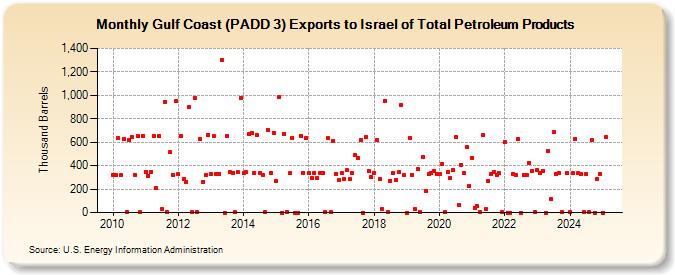
| Gulf Coast (PADD 3) Exports to Israel of Total Petroleum Products (Thousand Barrels) | ||||||||
| Year | Jan | Feb | Mar | Apr | May | Jun | Jul | Aug | Sep | Oct | Nov | Dec |
|---|---|---|---|---|---|---|---|---|---|---|---|---|
| 2010 | 323 | 319 | 634 | 321 | 630 | 2 | 615 | 645 | 323 | 657 | 1 | 656 |
| 2011 | 348 | 312 | 346 | 655 | 206 | 651 | 27 | 942 | 1 | 513 | 322 | 955 |
| 2012 | 326 | 652 | 285 | 263 | 904 | 1 | 981 | 1 | 626 | 258 | 319 | 663 |
| 2013 | 332 | 650 | 326 | 333 | 1,304 | 0 | 652 | 342 | 340 | 1 | 342 | 981 |
| 2014 | 335 | 345 | 672 | 676 | 337 | 662 | 336 | 319 | 1 | 708 | 340 | 680 |
| 2015 | 267 | 988 | 0 | 673 | 1 | 334 | 637 | 0 | 0 | 656 | 339 | 637 |
| 2016 | 334 | 296 | 334 | 297 | 334 | 335 | 9 | 637 | 1 | 611 | 333 | 279 |
| 2017 | 335 | 286 | 359 | 282 | 334 | 489 | 463 | 616 | 0 | 645 | 355 | 303 |
| 2018 | 338 | 619 | 286 | 31 | 954 | 3 | 272 | 334 | 279 | 344 | 917 | 319 |
| 2019 | 0 | 639 | 323 | 30 | 370 | 1 | 470 | 184 | 326 | 334 | 356 | 333 |
| 2020 | 330 | 410 | 6 | 342 | 292 | 363 | 644 | 66 | 407 | 334 | 561 | 225 |
| 2021 | 468 | 42 | 53 | 6 | 664 | 29 | 267 | 333 | 343 | 323 | 334 | 8 |
| 2022 | 605 | 0 | 0 | 333 | 324 | 626 | 0 | 319 | 321 | 423 | 356 | 1 |
| 2023 | 365 | 334 | 351 | 0 | 523 | 117 | 683 | 327 | 334 | 1 | 334 | |
| 2024 | 2 | |||||||||||
| - = No Data Reported; -- = Not Applicable; NA = Not Available; W = Withheld to avoid disclosure of individual company data. |
| Release Date: 3/29/2024 |
| Next Release Date: 4/30/2024 |