|
Download Data (XLS File) |
|
||||||||
|
||||||||
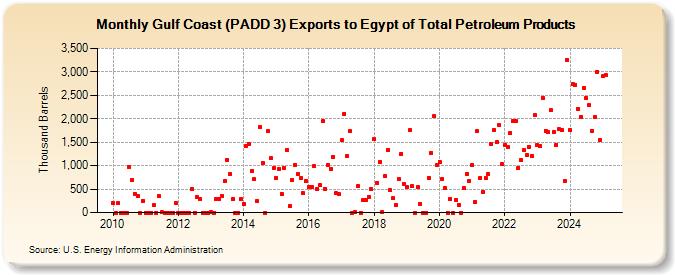
| Gulf Coast (PADD 3) Exports to Egypt of Total Petroleum Products (Thousand Barrels) | ||||||||
| Year | Jan | Feb | Mar | Apr | May | Jun | Jul | Aug | Sep | Oct | Nov | Dec |
|---|---|---|---|---|---|---|---|---|---|---|---|---|
| 2010 | 200 | 1 | 209 | 0 | 0 | 1 | 962 | 692 | 406 | 355 | 1 | 257 |
| 2011 | 1 | 1 | 1 | 152 | 1 | 345 | 2 | 0 | 0 | 0 | 0 | 213 |
| 2012 | 0 | 0 | 0 | 1 | 0 | 511 | 0 | 331 | 285 | 1 | 0 | 1 |
| 2013 | 3 | 1 | 288 | 285 | 360 | 663 | 1,130 | 821 | 284 | 0 | 1 | 284 |
| 2014 | 183 | 1,427 | 1,463 | 893 | 706 | 246 | 1,826 | 1,067 | 1 | 1,731 | 1,155 | 941 |
| 2015 | 741 | 935 | 405 | 955 | 1,334 | 139 | 694 | 1,009 | 824 | 739 | 407 | 674 |
| 2016 | 545 | 553 | 987 | 505 | 585 | 1,942 | 509 | 1,018 | 939 | 1,191 | 409 | 389 |
| 2017 | 1,540 | 2,109 | 1,196 | 1,730 | 1 | 13 | 564 | 0 | 275 | 266 | 342 | 495 |
| 2018 | 1,559 | 634 | 1,073 | 11 | 774 | 1,332 | 472 | 300 | 166 | 709 | 1,256 | 617 |
| 2019 | 549 | 1,753 | 558 | 0 | 543 | 186 | 0 | 0 | 738 | 1,275 | 2,056 | 1,022 |
| 2020 | 1,076 | 717 | 530 | 0 | 287 | 0 | 275 | 169 | 0 | 519 | 828 | 673 |
| 2021 | 1,007 | 222 | 1,736 | 738 | 444 | 734 | 819 | 1,472 | 1,763 | 1,495 | 1,861 | 1,026 |
| 2022 | 1,437 | 1,404 | 1,697 | 1,951 | 1,959 | 950 | 1,121 | 1,333 | 1,218 | 1,407 | 1,213 | 2,073 |
| 2023 | 1,434 | 1,949 | 1,996 | 1,795 | 1,710 | 2,525 | 1,373 | 1,446 | 1,776 | 1,583 | 678 | 3,260 |
| 2024 | 1,757 | |||||||||||
| - = No Data Reported; -- = Not Applicable; NA = Not Available; W = Withheld to avoid disclosure of individual company data. |
| Release Date: 3/29/2024 |
| Next Release Date: 4/30/2024 |