|
Download Data (XLS File) |
|
||||||||
|
||||||||
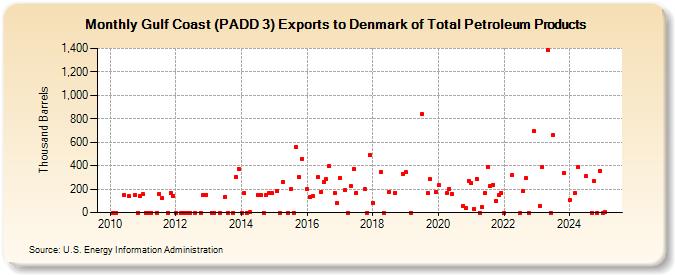
| Gulf Coast (PADD 3) Exports to Denmark of Total Petroleum Products (Thousand Barrels) | ||||||||
| Year | Jan | Feb | Mar | Apr | May | Jun | Jul | Aug | Sep | Oct | Nov | Dec |
|---|---|---|---|---|---|---|---|---|---|---|---|---|
| 2010 | 0 | 0 | 152 | 137 | 152 | 0 | 143 | |||||
| 2011 | 156 | 0 | 0 | 0 | 0 | 160 | 120 | 0 | 169 | 144 | ||
| 2012 | 0 | 0 | 0 | 0 | 0 | 0 | 0 | 152 | 154 | |||
| 2013 | 0 | 0 | 0 | 136 | 0 | 0 | 307 | 374 | ||||
| 2014 | 0 | 165 | 0 | 4 | 151 | 149 | 0 | 150 | 163 | 167 | ||
| 2015 | 182 | 0 | 259 | 0 | 198 | 0 | 555 | 300 | 461 | |||
| 2016 | 198 | 131 | 140 | 301 | 177 | 258 | 286 | 393 | 169 | 79 | ||
| 2017 | 295 | 193 | 0 | 224 | 373 | 169 | 198 | 0 | 491 | |||
| 2018 | 85 | 345 | 0 | 178 | 170 | 331 | ||||||
| 2019 | 345 | 0 | 841 | 165 | 286 | 176 | ||||||
| 2020 | 231 | 166 | 204 | 161 | 60 | 40 | 271 | |||||
| 2021 | 251 | 33 | 288 | 0 | 47 | 166 | 391 | 225 | 239 | 97 | 151 | 167 |
| 2022 | 0 | 320 | 0 | 184 | 293 | 0 | 694 | |||||
| 2023 | 56 | 388 | 1,383 | 0 | 660 | 339 | ||||||
| 2024 | 107 | 165 | 385 | |||||||||
| - = No Data Reported; -- = Not Applicable; NA = Not Available; W = Withheld to avoid disclosure of individual company data. |
| Release Date: 8/30/2024 |
| Next Release Date: 9/30/2024 |