|
Download Data (XLS File) |
|
||||||||
|
||||||||
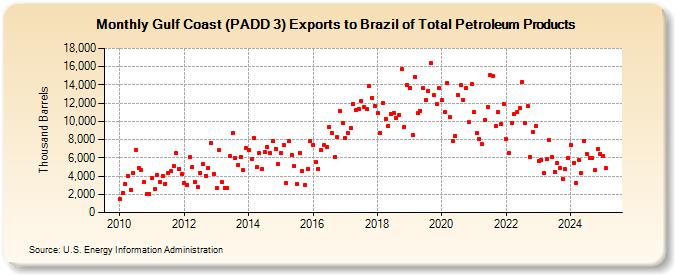
| Gulf Coast (PADD 3) Exports to Brazil of Total Petroleum Products (Thousand Barrels) | ||||||||
| Year | Jan | Feb | Mar | Apr | May | Jun | Jul | Aug | Sep | Oct | Nov | Dec |
|---|---|---|---|---|---|---|---|---|---|---|---|---|
| 2010 | 1,513 | 2,172 | 3,104 | 3,985 | 2,450 | 4,311 | 6,869 | 4,916 | 4,617 | 3,362 | 2,080 | 2,084 |
| 2011 | 3,796 | 2,540 | 4,110 | 3,324 | 4,009 | 3,174 | 4,336 | 4,544 | 5,109 | 6,480 | 4,789 | 4,226 |
| 2012 | 3,243 | 2,998 | 6,055 | 4,987 | 3,357 | 2,781 | 4,332 | 5,339 | 4,059 | 4,877 | 7,617 | 4,273 |
| 2013 | 2,732 | 6,813 | 3,365 | 2,735 | 2,706 | 6,147 | 8,711 | 5,982 | 5,210 | 6,128 | 4,660 | 7,026 |
| 2014 | 6,859 | 5,848 | 8,145 | 4,943 | 6,511 | 4,791 | 6,687 | 7,210 | 6,554 | 7,874 | 7,004 | 5,318 |
| 2015 | 6,543 | 7,425 | 3,207 | 7,853 | 6,292 | 5,129 | 3,173 | 6,578 | 4,583 | 3,011 | 4,776 | 7,820 |
| 2016 | 7,430 | 5,489 | 4,808 | 6,823 | 7,374 | 7,226 | 9,392 | 8,716 | 6,045 | 8,244 | 11,152 | 9,775 |
| 2017 | 8,196 | 8,735 | 9,244 | 11,906 | 11,238 | 11,408 | 12,283 | 11,605 | 11,321 | 13,902 | 12,560 | 11,701 |
| 2018 | 10,866 | 8,765 | 12,045 | 10,297 | 9,538 | 10,836 | 10,953 | 10,335 | 10,676 | 15,687 | 9,423 | 13,979 |
| 2019 | 13,683 | 8,475 | 14,870 | 10,891 | 11,148 | 13,670 | 12,381 | 13,349 | 16,386 | 12,849 | 11,873 | 13,683 |
| 2020 | 12,328 | 11,065 | 14,187 | 10,441 | 7,883 | 8,414 | 12,885 | 13,936 | 12,388 | 13,611 | 9,879 | 14,082 |
| 2021 | 10,978 | 8,684 | 8,076 | 7,482 | 10,141 | 11,600 | 15,097 | 14,997 | 9,464 | 11,038 | 9,722 | 11,935 |
| 2022 | 8,058 | 6,485 | 9,831 | 10,824 | 11,029 | 11,432 | 14,353 | 9,804 | 11,637 | 6,090 | 8,837 | 9,506 |
| 2023 | 5,604 | 5,253 | 4,661 | 5,771 | 8,083 | 6,041 | 4,958 | 5,882 | 4,863 | 3,710 | 4,421 | 5,472 |
| 2024 | 7,398 | |||||||||||
| - = No Data Reported; -- = Not Applicable; NA = Not Available; W = Withheld to avoid disclosure of individual company data. |
| Release Date: 3/29/2024 |
| Next Release Date: 4/30/2024 |