|
Download Data (XLS File) |
|
||||||||
|
||||||||
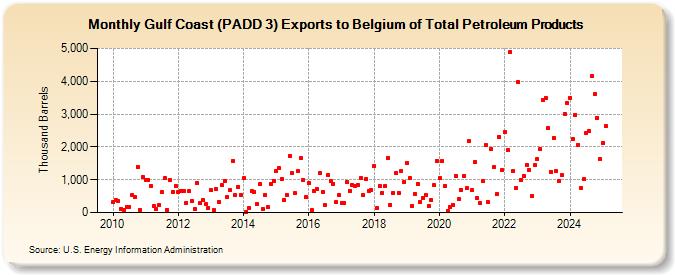
| Gulf Coast (PADD 3) Exports to Belgium of Total Petroleum Products (Thousand Barrels) | ||||||||
| Year | Jan | Feb | Mar | Apr | May | Jun | Jul | Aug | Sep | Oct | Nov | Dec |
|---|---|---|---|---|---|---|---|---|---|---|---|---|
| 2010 | 310 | 382 | 349 | 109 | 87 | 168 | 179 | 542 | 471 | 1,396 | 90 | 1,086 |
| 2011 | 985 | 992 | 809 | 191 | 108 | 219 | 621 | 1,043 | 75 | 1,001 | 641 | 806 |
| 2012 | 614 | 666 | 662 | 292 | 642 | 354 | 108 | 900 | 288 | 390 | 253 | 133 |
| 2013 | 685 | 77 | 711 | 332 | 835 | 964 | 470 | 677 | 1,582 | 525 | 793 | 545 |
| 2014 | 1,041 | 26 | 143 | 648 | 626 | 262 | 862 | 110 | 537 | 156 | 882 | 970 |
| 2015 | 1,274 | 1,348 | 1,019 | 378 | 547 | 1,727 | 1,192 | 583 | 1,260 | 1,648 | 1,006 | 468 |
| 2016 | 892 | 69 | 659 | 715 | 1,196 | 637 | 219 | 1,138 | 954 | 885 | 316 | 536 |
| 2017 | 289 | 288 | 927 | 663 | 841 | 810 | 848 | 1,046 | 536 | 1,011 | 670 | 682 |
| 2018 | 1,417 | 135 | 798 | 597 | 807 | 1,655 | 235 | 591 | 1,192 | 607 | 1,271 | 945 |
| 2019 | 1,523 | 1,043 | 206 | 567 | 882 | 328 | 453 | 541 | 208 | 376 | 826 | 1,579 |
| 2020 | 1,039 | 1,575 | 802 | 60 | 165 | 245 | 1,114 | 403 | 681 | 1,108 | 742 | 2,165 |
| 2021 | 680 | 1,539 | 436 | 287 | 952 | 2,052 | 313 | 1,936 | 1,376 | 560 | 2,306 | 1,302 |
| 2022 | 2,452 | 1,898 | 4,905 | 1,254 | 759 | 3,971 | 997 | 1,124 | 1,445 | 1,299 | 503 | 1,441 |
| 2023 | 1,878 | 1,318 | 2,581 | 3,496 | 2,385 | 1,448 | 2,579 | 672 | 703 | 1,143 | 3,043 | 3,609 |
| 2024 | 3,502 | |||||||||||
| - = No Data Reported; -- = Not Applicable; NA = Not Available; W = Withheld to avoid disclosure of individual company data. |
| Release Date: 3/29/2024 |
| Next Release Date: 4/30/2024 |