|
Download Data (XLS File) |
|
||||||||
|
||||||||
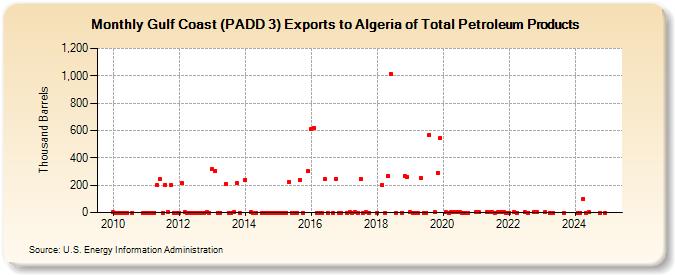
| Gulf Coast (PADD 3) Exports to Algeria of Total Petroleum Products (Thousand Barrels) | ||||||||
| Year | Jan | Feb | Mar | Apr | May | Jun | Jul | Aug | Sep | Oct | Nov | Dec |
|---|---|---|---|---|---|---|---|---|---|---|---|---|
| 2010 | 2 | 0 | 0 | 0 | 0 | 0 | 0 | 0 | ||||
| 2011 | 0 | 0 | 0 | 0 | 200 | 243 | 0 | 204 | 1 | 200 | 0 | 0 |
| 2012 | 0 | 214 | 1 | 0 | 0 | 0 | 0 | 0 | 0 | 0 | 1 | 0 |
| 2013 | 317 | 306 | 0 | 0 | 212 | 0 | 0 | 1 | 214 | 0 | ||
| 2014 | 240 | 1 | 0 | 0 | 0 | 0 | 0 | 0 | 0 | 0 | ||
| 2015 | 0 | 0 | 0 | 0 | 226 | 0 | 0 | 0 | 237 | 0 | 305 | |
| 2016 | 611 | 620 | 0 | 0 | 0 | 247 | 0 | 0 | 247 | 0 | 0 | |
| 2017 | 0 | 1 | 0 | 1 | 0 | 247 | 0 | 1 | 0 | |||
| 2018 | 0 | 203 | 0 | 269 | 1,016 | 0 | 0 | 268 | 260 | |||
| 2019 | 3 | 0 | 0 | 0 | 251 | 0 | 0 | 567 | 1 | 292 | 545 | |
| 2020 | 1 | 0 | 1 | 1 | 1 | 1 | 0 | 0 | 0 | |||
| 2021 | 2 | 1 | 1 | 2 | 1 | 0 | 1 | 1 | 1 | 0 | ||
| 2022 | 0 | 3 | 0 | 1 | 0 | 2 | 1 | |||||
| 2023 | 1 | 0 | 0 | 0 | ||||||||
| - = No Data Reported; -- = Not Applicable; NA = Not Available; W = Withheld to avoid disclosure of individual company data. |
| Release Date: 3/29/2024 |
| Next Release Date: 4/30/2024 |