|
Download Data (XLS File) |
|
||||||||
|
||||||||
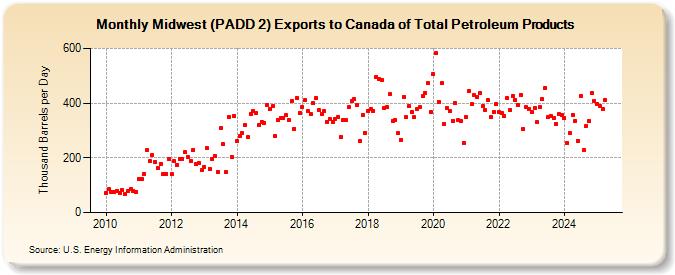
| Midwest (PADD 2) Exports to Canada of Total Petroleum Products (Thousand Barrels per Day) | ||||||||
| Year | Jan | Feb | Mar | Apr | May | Jun | Jul | Aug | Sep | Oct | Nov | Dec |
|---|---|---|---|---|---|---|---|---|---|---|---|---|
| 2010 | 73 | 86 | 75 | 76 | 79 | 73 | 81 | 68 | 77 | 85 | 78 | 76 |
| 2011 | 123 | 123 | 141 | 227 | 187 | 211 | 184 | 164 | 179 | 141 | 142 | 195 |
| 2012 | 140 | 188 | 175 | 196 | 196 | 221 | 204 | 188 | 230 | 176 | 181 | 154 |
| 2013 | 168 | 235 | 161 | 194 | 206 | 149 | 308 | 249 | 148 | 349 | 204 | 354 |
| 2014 | 261 | 280 | 290 | 320 | 275 | 361 | 370 | 365 | 320 | 332 | 329 | 394 |
| 2015 | 378 | 389 | 278 | 340 | 346 | 344 | 355 | 337 | 407 | 307 | 419 | 365 |
| 2016 | 386 | 410 | 372 | 359 | 399 | 418 | 374 | 361 | 370 | 332 | 342 | 332 |
| 2017 | 343 | 351 | 277 | 337 | 337 | 385 | 408 | 414 | 394 | 260 | 358 | 292 |
| 2018 | 372 | 379 | 373 | 496 | 489 | 485 | 381 | 385 | 432 | 336 | 338 | 289 |
| 2019 | 267 | 424 | 348 | 389 | 368 | 348 | 379 | 384 | 426 | 438 | 472 | 368 |
| 2020 | 506 | 582 | 405 | 473 | 323 | 381 | 372 | 335 | 399 | 338 | 334 | 255 |
| 2021 | 348 | 445 | 395 | 428 | 424 | 436 | 388 | 376 | 410 | 349 | 368 | 397 |
| 2022 | 366 | 363 | 352 | 417 | 374 | 426 | 412 | 393 | 430 | 306 | 384 | 377 |
| 2023 | 358 | 368 | 327 | 383 | 295 | 347 | 282 | 262 | 268 | 248 | 358 | 352 |
| 2024 | 346 | |||||||||||
| - = No Data Reported; -- = Not Applicable; NA = Not Available; W = Withheld to avoid disclosure of individual company data. |
| Release Date: 3/29/2024 |
| Next Release Date: 4/30/2024 |