|
Download Data (XLS File) |
|
||||||||
|
||||||||
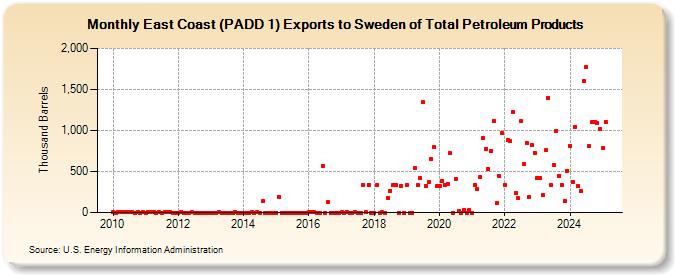
| East Coast (PADD 1) Exports to Sweden of Total Petroleum Products (Thousand Barrels) | ||||||||
| Year | Jan | Feb | Mar | Apr | May | Jun | Jul | Aug | Sep | Oct | Nov | Dec |
|---|---|---|---|---|---|---|---|---|---|---|---|---|
| 2010 | 6 | 0 | 1 | 2 | 1 | 1 | 1 | 1 | 0 | 1 | 0 | 1 |
| 2011 | 0 | 2 | 1 | 1 | 0 | 1 | 0 | 1 | 1 | 1 | 0 | 0 |
| 2012 | 0 | 1 | 0 | 0 | 0 | 1 | 0 | 0 | 0 | 0 | 0 | 0 |
| 2013 | 0 | 0 | 0 | 1 | 0 | 0 | 0 | 0 | 0 | 1 | 0 | 0 |
| 2014 | 0 | 0 | 0 | 1 | 0 | 1 | 0 | 136 | 0 | 0 | 0 | 0 |
| 2015 | 0 | 190 | 0 | 0 | 0 | 0 | 0 | 0 | 0 | 0 | 0 | 0 |
| 2016 | 1 | 2 | 3 | 0 | 0 | 572 | 0 | 131 | 0 | 0 | 0 | 0 |
| 2017 | 5 | 0 | 1 | 0 | 0 | 1 | 0 | 0 | 340 | 1 | 340 | 0 |
| 2018 | 0 | 340 | 0 | 1 | 0 | 179 | 265 | 341 | 341 | 0 | 328 | 0 |
| 2019 | 336 | 0 | 0 | 543 | 331 | 416 | 1,341 | 327 | 367 | 654 | 796 | 319 |
| 2020 | 328 | 390 | 330 | 352 | 721 | 0 | 412 | 20 | 0 | 33 | 0 | 33 |
| 2021 | 0 | 340 | 284 | 431 | 911 | 779 | 527 | 749 | 1,113 | 111 | 445 | 972 |
| 2022 | 339 | 879 | 871 | 1,231 | 242 | 172 | 1,111 | 592 | 844 | 192 | 822 | 727 |
| 2023 | 615 | 427 | 213 | 757 | 1,283 | 338 | 578 | 999 | 450 | 338 | 139 | 339 |
| 2024 | 814 | |||||||||||
| - = No Data Reported; -- = Not Applicable; NA = Not Available; W = Withheld to avoid disclosure of individual company data. |
| Release Date: 3/29/2024 |
| Next Release Date: 4/30/2024 |