|
Download Data (XLS File) |
|
||||||||
|
||||||||
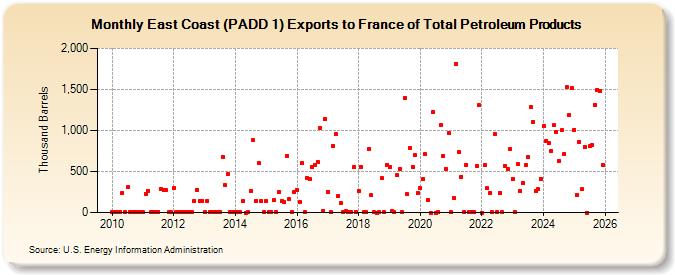
| East Coast (PADD 1) Exports to France of Total Petroleum Products (Thousand Barrels) | ||||||||
| Year | Jan | Feb | Mar | Apr | May | Jun | Jul | Aug | Sep | Oct | Nov | Dec |
|---|---|---|---|---|---|---|---|---|---|---|---|---|
| 2010 | 1 | 2 | 4 | 3 | 241 | 3 | 308 | 4 | 1 | 2 | 2 | 3 |
| 2011 | 2 | 230 | 267 | 5 | 5 | 2 | 4 | 290 | 276 | 275 | 2 | 1 |
| 2012 | 303 | 1 | 1 | 1 | 1 | 1 | 1 | 1 | 143 | 280 | 142 | 142 |
| 2013 | 1 | 143 | 2 | 1 | 1 | 1 | 1 | 677 | 331 | 466 | 1 | 1 |
| 2014 | 1 | 1 | 1 | 137 | 0 | 2 | 260 | 878 | 144 | 609 | 140 | 3 |
| 2015 | 139 | 4 | 4 | 148 | 2 | 251 | 143 | 134 | 693 | 160 | 4 | 248 |
| 2016 | 278 | 124 | 606 | 1 | 418 | 410 | 554 | 584 | 617 | 1,027 | 19 | 1,140 |
| 2017 | 251 | 1 | 814 | 954 | 204 | 122 | 2 | 16 | 11 | 2 | 552 | 4 |
| 2018 | 264 | 552 | 1 | 2 | 772 | 210 | 1 | 0 | 1 | 417 | 1 | 584 |
| 2019 | 551 | 14 | 1 | 454 | 533 | 1 | 1,399 | 223 | 790 | 561 | 697 | 241 |
| 2020 | 294 | 405 | 708 | 156 | 0 | 1,222 | 0 | 2 | 1,061 | 691 | 534 | 971 |
| 2021 | 1 | 183 | 1,810 | 734 | 436 | 5 | 585 | 1 | 1 | 1 | 563 | 1,305 |
| 2022 | 0 | 576 | 296 | 241 | 1 | 958 | 1 | 243 | 1 | 571 | 527 | 773 |
| 2023 | 414 | 1 | 307 | 259 | 362 | 580 | 673 | 1,384 | 1,107 | 265 | 281 | 414 |
| 2024 | 1,052 | |||||||||||
| - = No Data Reported; -- = Not Applicable; NA = Not Available; W = Withheld to avoid disclosure of individual company data. |
| Release Date: 3/29/2024 |
| Next Release Date: 4/30/2024 |