|
Download Data (XLS File) |
|
||||||||
|
||||||||
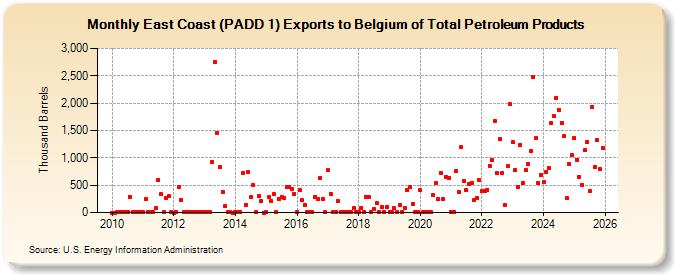
| East Coast (PADD 1) Exports to Belgium of Total Petroleum Products (Thousand Barrels) | ||||||||
| Year | Jan | Feb | Mar | Apr | May | Jun | Jul | Aug | Sep | Oct | Nov | Dec |
|---|---|---|---|---|---|---|---|---|---|---|---|---|
| 2010 | 1 | 1 | 3 | 8 | 7 | 5 | 6 | 285 | 6 | 4 | 2 | 4 |
| 2011 | 2 | 256 | 4 | 2 | 3 | 81 | 592 | 333 | 3 | 268 | 302 | 2 |
| 2012 | 1 | 3 | 463 | 235 | 3 | 3 | 2 | 4 | 7 | 6 | 3 | 5 |
| 2013 | 2 | 2 | 4 | 930 | 2,757 | 1,453 | 830 | 381 | 116 | 2 | 4 | 1 |
| 2014 | 4 | 4 | 6 | 730 | 140 | 737 | 285 | 502 | 2 | 305 | 213 | 1 |
| 2015 | 2 | 284 | 206 | 342 | 2 | 253 | 278 | 265 | 475 | 459 | 433 | 345 |
| 2016 | 12 | 407 | 222 | 138 | 3 | 4 | 3 | 289 | 240 | 640 | 245 | 3 |
| 2017 | 776 | 334 | 4 | 4 | 216 | 4 | 2 | 4 | 4 | 3 | 78 | 3 |
| 2018 | 2 | 88 | 5 | 287 | 278 | 3 | 69 | 177 | 4 | 108 | 3 | 106 |
| 2019 | 3 | 4 | 78 | 4 | 142 | 4 | 90 | 406 | 468 | 165 | 5 | 4 |
| 2020 | 419 | 4 | 4 | 2 | 3 | 317 | 547 | 243 | 725 | 247 | 652 | 633 |
| 2021 | 6 | 4 | 761 | 382 | 1,193 | 577 | 413 | 522 | 548 | 225 | 267 | 591 |
| 2022 | 394 | 399 | 420 | 857 | 958 | 1,674 | 718 | 1,342 | 717 | 132 | 843 | 1,981 |
| 2023 | 1,538 | 975 | 632 | 1,054 | 535 | 774 | 894 | 1,121 | 2,479 | 1,357 | 540 | 518 |
| 2024 | 572 | |||||||||||
| - = No Data Reported; -- = Not Applicable; NA = Not Available; W = Withheld to avoid disclosure of individual company data. |
| Release Date: 3/29/2024 |
| Next Release Date: 4/30/2024 |