|
Download Data (XLS File) |
|
||||||||
|
||||||||
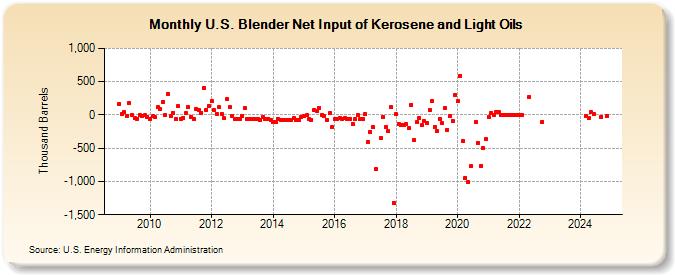
| U.S. Blender Net Input of Kerosene and Light Oils (Thousand Barrels) | ||||||||
| Year | Jan | Feb | Mar | Apr | May | Jun | Jul | Aug | Sep | Oct | Nov | Dec |
|---|---|---|---|---|---|---|---|---|---|---|---|---|
| 2009 | 165 | 16 | 39 | -9 | 178 | 0 | -44 | -54 | -3 | -12 | -7 | -30 |
| 2010 | -55 | -21 | -36 | 113 | 93 | 198 | -3 | 320 | -21 | 36 | -58 | 127 |
| 2011 | -57 | -45 | 25 | 112 | -25 | -67 | 96 | 74 | 34 | 411 | 79 | 131 |
| 2012 | 206 | 73 | 19 | 115 | 15 | -53 | 237 | 115 | -18 | -66 | -66 | -55 |
| 2013 | -12 | 99 | -66 | -61 | -60 | -62 | -66 | -69 | -33 | -54 | -59 | -83 |
| 2014 | -106 | -104 | -62 | -75 | -69 | -72 | -70 | -75 | -46 | -78 | -75 | -30 |
| 2015 | -23 | -8 | -68 | -69 | 68 | 55 | 110 | 0 | -17 | -70 | 24 | -184 |
| 2016 | -67 | -59 | -53 | -54 | -47 | -66 | -57 | -139 | -65 | -5 | -60 | -65 |
| 2017 | 17 | -404 | -250 | -186 | -818 | -345 | -33 | -184 | -249 | 115 | -1,319 | |
| 2018 | 12 | -140 | -158 | -151 | -135 | -197 | 154 | -381 | -112 | -50 | -158 | -95 |
| 2019 | -116 | 75 | 209 | -175 | -245 | -59 | -128 | 102 | -221 | -15 | -91 | 300 |
| 2020 | 203 | 592 | -389 | -946 | -1,012 | -775 | -103 | -421 | -763 | -498 | -364 | |
| 2021 | -30 | 30 | 0 | 44 | 43 | 0 | 0 | 0 | 0 | 0 | 0 | 0 |
| 2022 | 3 | 0 | 274 | -100 | ||||||||
| - = No Data Reported; -- = Not Applicable; NA = Not Available; W = Withheld to avoid disclosure of individual company data. |
| Release Date: 3/29/2024 |
| Next Release Date: 4/30/2024 |