|
Download Data (XLS File) |
|
||||||||
|
||||||||
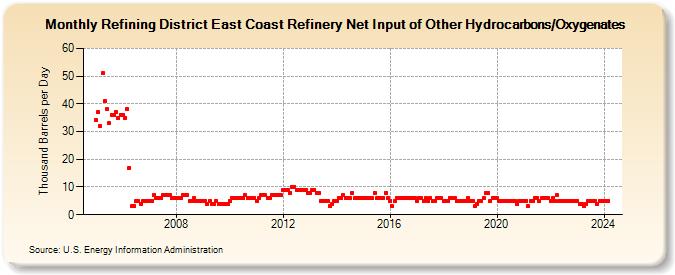
| Refining District East Coast Refinery Net Input of Other Hydrocarbons/Oxygenates (Thousand Barrels per Day) | ||||||||
| Year | Jan | Feb | Mar | Apr | May | Jun | Jul | Aug | Sep | Oct | Nov | Dec |
|---|---|---|---|---|---|---|---|---|---|---|---|---|
| 2005 | 34 | 37 | 32 | 51 | 41 | 38 | 33 | 36 | 36 | 37 | 35 | 36 |
| 2006 | 36 | 35 | 38 | 17 | 3 | 3 | 5 | 5 | 4 | 5 | 5 | 5 |
| 2007 | 5 | 5 | 7 | 6 | 6 | 6 | 7 | 7 | 7 | 7 | 6 | 6 |
| 2008 | 6 | 6 | 6 | 7 | 7 | 7 | 5 | 5 | 6 | 5 | 5 | 5 |
| 2009 | 5 | 5 | 4 | 5 | 4 | 4 | 5 | 4 | 4 | 4 | 4 | 4 |
| 2010 | 5 | 6 | 6 | 6 | 6 | 6 | 6 | 7 | 6 | 6 | 6 | 6 |
| 2011 | 5 | 6 | 7 | 7 | 7 | 6 | 6 | 7 | 7 | 7 | 7 | 7 |
| 2012 | 9 | 9 | 9 | 8 | 10 | 10 | 9 | 9 | 9 | 9 | 9 | 8 |
| 2013 | 8 | 9 | 9 | 8 | 8 | 5 | 5 | 5 | 5 | 3 | 4 | 5 |
| 2014 | 5 | 6 | 6 | 7 | 6 | 6 | 6 | 8 | 6 | 6 | 6 | 6 |
| 2015 | 6 | 6 | 6 | 6 | 6 | 8 | 6 | 6 | 6 | 6 | 8 | 6 |
| 2016 | 5 | 3 | 5 | 6 | 6 | 6 | 6 | 6 | 6 | 6 | 6 | 6 |
| 2017 | 5 | 6 | 6 | 5 | 6 | 5 | 6 | 5 | 5 | 6 | 6 | 6 |
| 2018 | 5 | 5 | 5 | 6 | 6 | 6 | 5 | 5 | 5 | 5 | 5 | 6 |
| 2019 | 5 | 5 | 3 | 4 | 5 | 5 | 6 | 8 | 8 | 5 | 6 | 6 |
| 2020 | 6 | 5 | 5 | 5 | 5 | 5 | 5 | 5 | 5 | 4 | 5 | 5 |
| 2021 | 5 | 5 | 3 | 5 | 5 | 6 | 6 | 5 | 6 | 6 | 6 | 6 |
| 2022 | 5 | 6 | 5 | 7 | 5 | 5 | 5 | 5 | 5 | 5 | 5 | 5 |
| 2023 | 5 | 4 | 4 | 3 | 4 | 5 | 5 | 5 | 5 | 4 | 5 | 5 |
| 2024 | 5 | 5 | ||||||||||
| - = No Data Reported; -- = Not Applicable; NA = Not Available; W = Withheld to avoid disclosure of individual company data. |
| Release Date: 4/30/2024 |
| Next Release Date: 5/31/2024 |