|
Download Data (XLS File) |
|
||||||||
|
||||||||
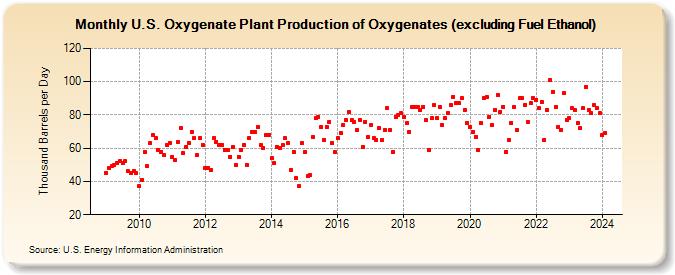
| U.S. Oxygenate Plant Production of Oxygenates (excluding Fuel Ethanol) (Thousand Barrels per Day) | ||||||||
| Year | Jan | Feb | Mar | Apr | May | Jun | Jul | Aug | Sep | Oct | Nov | Dec |
|---|---|---|---|---|---|---|---|---|---|---|---|---|
| 2009 | 45 | 48 | 49 | 50 | 51 | 52 | 51 | 52 | 46 | 45 | 46 | 45 |
| 2010 | 37 | 41 | 58 | 49 | 63 | 68 | 66 | 59 | 58 | 56 | 62 | 63 |
| 2011 | 55 | 53 | 64 | 72 | 57 | 61 | 63 | 70 | 66 | 56 | 66 | 62 |
| 2012 | 48 | 48 | 47 | 66 | 64 | 62 | 62 | 59 | 59 | 55 | 61 | 50 |
| 2013 | 55 | 59 | 62 | 50 | 66 | 70 | 70 | 73 | 62 | 60 | 68 | 68 |
| 2014 | 54 | 51 | 61 | 60 | 62 | 66 | 63 | 47 | 58 | 42 | 37 | 63 |
| 2015 | 58 | 43 | 44 | 67 | 78 | 79 | 73 | 65 | 73 | 76 | 63 | 58 |
| 2016 | 66 | 69 | 74 | 77 | 82 | 77 | 76 | 71 | 77 | 61 | 76 | 67 |
| 2017 | 74 | 66 | 65 | 72 | 65 | 71 | 84 | 71 | 58 | 79 | 80 | 81 |
| 2018 | 79 | 75 | 70 | 85 | 85 | 85 | 83 | 85 | 77 | 59 | 78 | 86 |
| 2019 | 78 | 85 | 74 | 78 | 81 | 86 | 91 | 87 | 87 | 90 | 83 | 75 |
| 2020 | 73 | 70 | 67 | 59 | 75 | 90 | 91 | 79 | 74 | 83 | 92 | 82 |
| 2021 | 85 | 58 | 65 | 75 | 85 | 71 | 90 | 90 | 86 | 76 | 87 | 90 |
| 2022 | 89 | 84 | 88 | 65 | 83 | 101 | 94 | 85 | 73 | 71 | 93 | 77 |
| 2023 | 78 | 84 | 83 | 75 | 72 | 84 | 97 | 83 | 81 | 86 | 84 | 81 |
| 2024 | 68 | |||||||||||
| - = No Data Reported; -- = Not Applicable; NA = Not Available; W = Withheld to avoid disclosure of individual company data. |
| Release Date: 3/29/2024 |
| Next Release Date: 4/30/2024 |
Referring Pages: