|
Download Data (XLS File) |
|
||||||||
|
||||||||
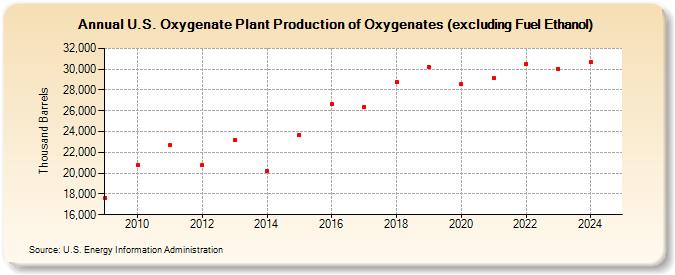
| U.S. Oxygenate Plant Production of Oxygenates (excluding Fuel Ethanol) (Thousand Barrels) | ||||||||
| Decade | Year-0 | Year-1 | Year-2 | Year-3 | Year-4 | Year-5 | Year-6 | Year-7 | Year-8 | Year-9 |
|---|---|---|---|---|---|---|---|---|---|---|
| 2000's | 17,630 | |||||||||
| 2010's | 20,777 | 22,680 | 20,747 | 23,216 | 20,188 | 23,692 | 26,617 | 26,360 | 28,813 | 30,217 |
| 2020's | 28,551 | 29,169 | 30,526 | 30,058 | 30,704 |
| - = No Data Reported; -- = Not Applicable; NA = Not Available; W = Withheld to avoid disclosure of individual company data. |
| Release Date: 6/30/2025 |
| Next Release Date: 8/29/2025 |
Referring Pages: