|
Download Data (XLS File) |
|
||||||||
|
||||||||
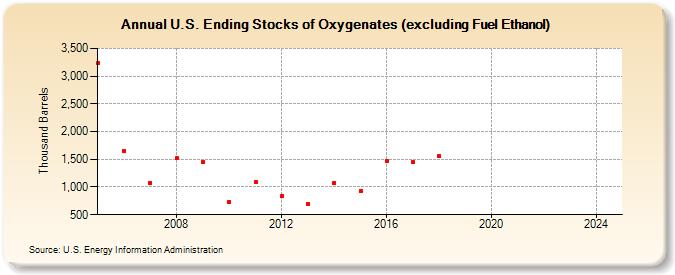
| U.S. Ending Stocks of Oxygenates (excluding Fuel Ethanol) (Thousand Barrels) | ||||||||
| Decade | Year-0 | Year-1 | Year-2 | Year-3 | Year-4 | Year-5 | Year-6 | Year-7 | Year-8 | Year-9 |
|---|---|---|---|---|---|---|---|---|---|---|
| 2000's | 3,236 | 1,656 | 1,075 | 1,514 | 1,443 | |||||
| 2010's | 731 | 1,085 | 836 | 695 | 1,070 | 927 | 1,477 | 1,446 | 1,551 | -- |
| 2020's | -- | -- | -- | -- |
| - = No Data Reported; -- = Not Applicable; NA = Not Available; W = Withheld to avoid disclosure of individual company data. |
| Release Date: 3/29/2024 |
| Next Release Date: 8/30/2024 |