|
Download Data (XLS File) |
|
||||||||
|
||||||||
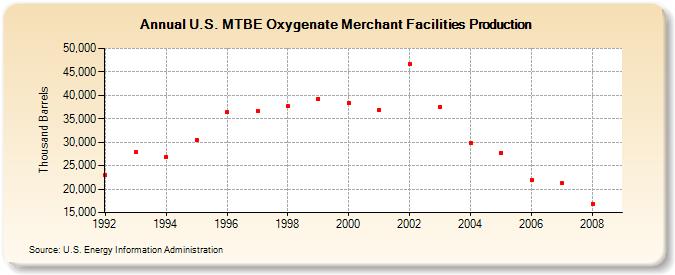
| U.S. MTBE Oxygenate Merchant Facilities Production (Thousand Barrels) | ||||||||
| Decade | Year-0 | Year-1 | Year-2 | Year-3 | Year-4 | Year-5 | Year-6 | Year-7 | Year-8 | Year-9 |
|---|---|---|---|---|---|---|---|---|---|---|
| 1990's | 22,945 | 27,842 | 26,941 | 30,536 | 36,386 | 36,757 | 37,717 | 39,267 | ||
| 2000's | 38,428 | 36,963 | 46,758 | 37,532 | 29,778 | 27,804 | 21,918 | 21,226 | 16,886 |
| - = No Data Reported; -- = Not Applicable; NA = Not Available; W = Withheld to avoid disclosure of individual company data. |
| Release Date: 3/29/2024 |
| Next Release Date: 8/30/2024 |