|
Download Data (XLS File) |
|
||||||||
|
||||||||
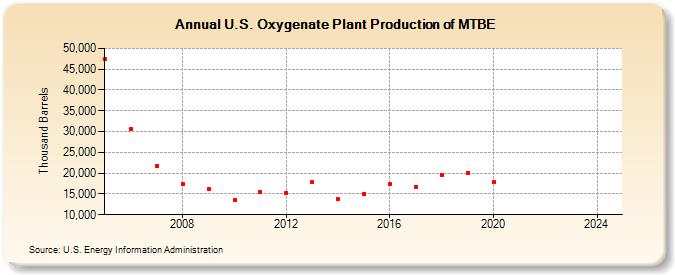
| U.S. Oxygenate Plant Production of MTBE (Thousand Barrels) | ||||||||
| Decade | Year-0 | Year-1 | Year-2 | Year-3 | Year-4 | Year-5 | Year-6 | Year-7 | Year-8 | Year-9 |
|---|---|---|---|---|---|---|---|---|---|---|
| 2000's | 47,374 | 30,698 | 21,706 | 17,319 | 16,109 | |||||
| 2010's | 13,499 | 15,363 | 15,304 | 17,768 | 13,756 | 14,962 | 17,342 | 16,685 | 19,664 | 20,105 |
| 2020's | 17,886 | -- | -- |
| - = No Data Reported; -- = Not Applicable; NA = Not Available; W = Withheld to avoid disclosure of individual company data. |
| Release Date: 3/29/2024 |
| Next Release Date: 8/30/2024 |