|
Download Data (XLS File) |
|
||||||||
|
||||||||
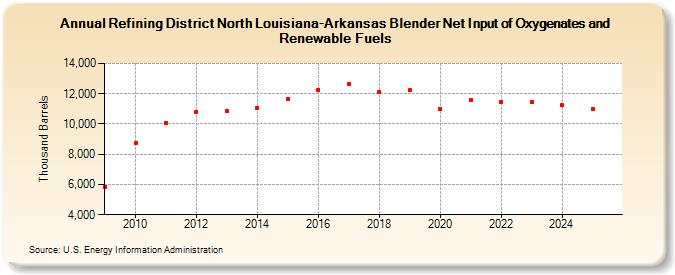
| Refining District North Louisiana-Arkansas Blender Net Input of Oxygenates and Renewable Fuels (Thousand Barrels) | ||||||||
| Decade | Year-0 | Year-1 | Year-2 | Year-3 | Year-4 | Year-5 | Year-6 | Year-7 | Year-8 | Year-9 |
|---|---|---|---|---|---|---|---|---|---|---|
| 2000's | 5,863 | |||||||||
| 2010's | 8,751 | 10,090 | 10,805 | 10,884 | 11,087 | 11,651 | 12,264 | 12,635 | 12,111 | 12,222 |
| 2020's | 11,003 | 11,595 | 11,484 | 11,470 |
| - = No Data Reported; -- = Not Applicable; NA = Not Available; W = Withheld to avoid disclosure of individual company data. |
| Release Date: 6/28/2024 |
| Next Release Date: 8/30/2024 |