|
Download Data (XLS File) |
|
||||||||
|
||||||||
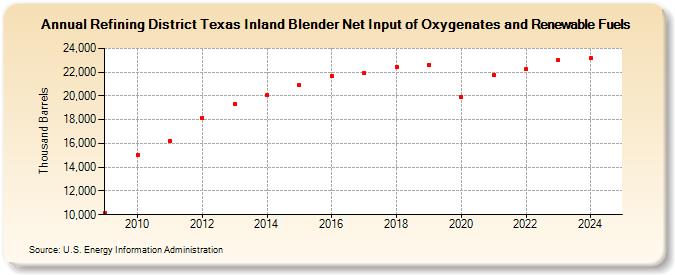
| Refining District Texas Inland Blender Net Input of Oxygenates and Renewable Fuels (Thousand Barrels) | ||||||||
| Decade | Year-0 | Year-1 | Year-2 | Year-3 | Year-4 | Year-5 | Year-6 | Year-7 | Year-8 | Year-9 |
|---|---|---|---|---|---|---|---|---|---|---|
| 2000's | 10,132 | |||||||||
| 2010's | 15,065 | 16,234 | 18,180 | 19,355 | 20,042 | 20,897 | 21,680 | 21,936 | 22,439 | 22,639 |
| 2020's | 19,941 | 21,766 | 22,244 | 22,975 |
| - = No Data Reported; -- = Not Applicable; NA = Not Available; W = Withheld to avoid disclosure of individual company data. |
| Release Date: 3/29/2024 |
| Next Release Date: 8/30/2024 |
Referring Pages: