|
Download Data (XLS File) |
|
||||||||
|
||||||||
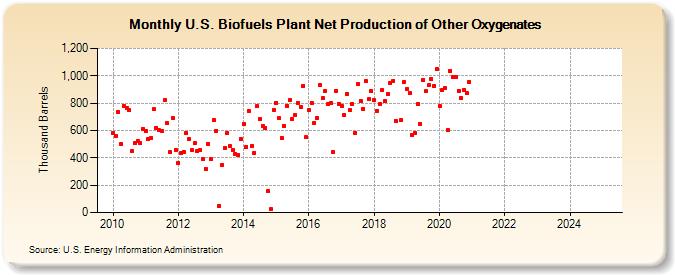
| U.S. Biofuels Plant Net Production of Other Oxygenates (Thousand Barrels) | ||||||||
| Year | Jan | Feb | Mar | Apr | May | Jun | Jul | Aug | Sep | Oct | Nov | Dec |
|---|---|---|---|---|---|---|---|---|---|---|---|---|
| 2010 | 583 | 560 | 736 | 502 | 781 | 764 | 748 | 451 | 508 | 523 | 509 | 613 |
| 2011 | 599 | 539 | 547 | 755 | 621 | 601 | 598 | 820 | 651 | 440 | 688 | 458 |
| 2012 | 363 | 437 | 442 | 581 | 538 | 454 | 505 | 449 | 457 | 392 | 322 | 503 |
| 2013 | 390 | 677 | 597 | 50 | 348 | 471 | 582 | 484 | 459 | 431 | 420 | 539 |
| 2014 | 647 | 480 | 742 | 485 | 438 | 777 | 681 | 631 | 620 | 156 | 24 | 751 |
| 2015 | 803 | 691 | 548 | 636 | 782 | 824 | 682 | 710 | 803 | 775 | 926 | 550 |
| 2016 | 748 | 801 | 657 | 692 | 932 | 836 | 889 | 791 | 802 | 441 | 892 | 794 |
| 2017 | 778 | 713 | 868 | 748 | 792 | 585 | 940 | 815 | 759 | 959 | 828 | 890 |
| 2018 | 820 | 745 | 795 | 895 | 812 | 866 | 949 | 964 | 671 | 675 | 957 | |
| 2019 | 905 | 873 | 564 | 583 | 795 | 648 | 972 | 886 | 931 | 977 | 928 | 1,049 |
| 2020 | 780 | 898 | 908 | 601 | 1,037 | 993 | 992 | 892 | 837 | 899 | 872 | 957 |
| 2021 | -- | -- | -- | -- | -- | -- | -- | -- | -- | -- | -- | -- |
| 2022 | -- | -- | -- | -- | -- | -- | -- | -- | -- | -- | -- | -- |
| 2023 | -- | -- | -- | -- | -- | -- | -- | -- | -- | -- | -- | -- |
| 2024 | -- | |||||||||||
| - = No Data Reported; -- = Not Applicable; NA = Not Available; W = Withheld to avoid disclosure of individual company data. |
| Release Date: 3/29/2024 |
| Next Release Date: 4/30/2024 |
Referring Pages: