|
Download Data (XLS File) |
|
||||||||
|
||||||||
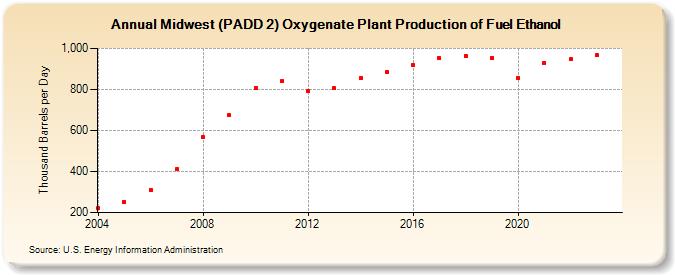
| Midwest (PADD 2) Oxygenate Plant Production of Fuel Ethanol (Thousand Barrels per Day) | ||||||||
| Decade | Year-0 | Year-1 | Year-2 | Year-3 | Year-4 | Year-5 | Year-6 | Year-7 | Year-8 | Year-9 |
|---|---|---|---|---|---|---|---|---|---|---|
| 2000's | 220 | 253 | 310 | 410 | 566 | 674 | ||||
| 2010's | 806 | 840 | 792 | 805 | 855 | 884 | 918 | 952 | 965 | 955 |
| 2020's | 858 | 931 | 946 | 966 |
| - = No Data Reported; -- = Not Applicable; NA = Not Available; W = Withheld to avoid disclosure of individual company data. |
| Release Date: 4/30/2024 |
| Next Release Date: 8/30/2024 |
Referring Pages: