|
Download Data (XLS File) |
|
||||||||
|
||||||||
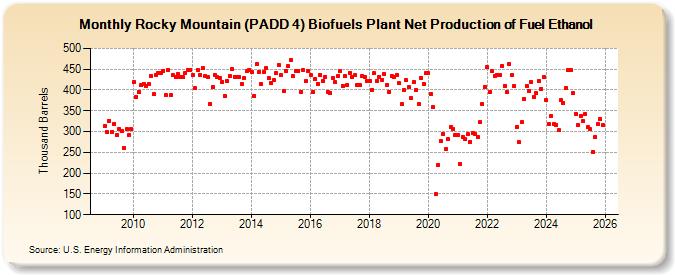
| Rocky Mountain (PADD 4) Biofuels Plant Net Production of Fuel Ethanol (Thousand Barrels) | ||||||||
| Year | Jan | Feb | Mar | Apr | May | Jun | Jul | Aug | Sep | Oct | Nov | Dec |
|---|---|---|---|---|---|---|---|---|---|---|---|---|
| 2009 | 313 | 298 | 326 | 299 | 319 | 292 | 306 | 301 | 261 | 305 | 292 | 306 |
| 2010 | 419 | 383 | 395 | 411 | 415 | 410 | 414 | 434 | 390 | 437 | 440 | 441 |
| 2011 | 446 | 387 | 448 | 388 | 436 | 430 | 439 | 432 | 430 | 440 | 447 | 449 |
| 2012 | 436 | 404 | 449 | 437 | 453 | 433 | 431 | 367 | 407 | 437 | 430 | 429 |
| 2013 | 420 | 386 | 422 | 433 | 450 | 432 | 430 | 432 | 415 | 429 | 445 | 449 |
| 2014 | 444 | 386 | 462 | 444 | 414 | 444 | 452 | 428 | 416 | 424 | 441 | 461 |
| 2015 | 435 | 397 | 445 | 457 | 472 | 433 | 446 | 446 | 396 | 447 | 422 | 446 |
| 2016 | 435 | 395 | 426 | 415 | 435 | 422 | 432 | 395 | 393 | 428 | 418 | 434 |
| 2017 | 445 | 410 | 433 | 413 | 442 | 431 | 436 | 413 | 411 | 434 | 431 | 421 |
| 2018 | 421 | 401 | 440 | 422 | 432 | 425 | 439 | 413 | 396 | 434 | 431 | 436 |
| 2019 | 416 | 366 | 400 | 423 | 406 | 380 | 419 | 399 | 366 | 429 | 414 | 440 |
| 2020 | 440 | 391 | 359 | 149 | 219 | 277 | 294 | 257 | 282 | 311 | 305 | 292 |
| 2021 | 291 | 222 | 288 | 281 | 293 | 276 | 296 | 294 | 288 | 322 | 366 | 408 |
| 2022 | 455 | 395 | 445 | 434 | 437 | 437 | 458 | 410 | 395 | 462 | 435 | 409 |
| 2023 | 311 | 274 | 322 | 379 | 410 | 397 | 418 | 384 | 392 | 422 | 403 | 431 |
| 2024 | 375 | 318 | 337 | 318 | ||||||||
| - = No Data Reported; -- = Not Applicable; NA = Not Available; W = Withheld to avoid disclosure of individual company data. |
| Release Date: 6/28/2024 |
| Next Release Date: 7/31/2024 |