|
Download Data (XLS File) |
|
||||||||
|
||||||||
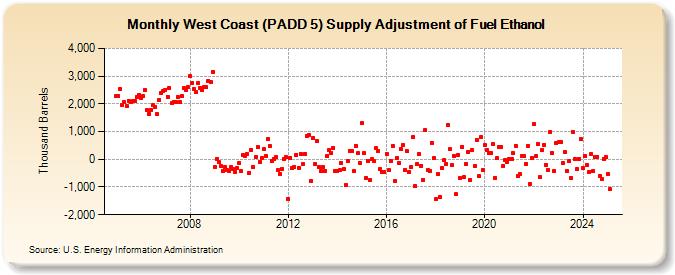
| West Coast (PADD 5) Supply Adjustment of Fuel Ethanol (Thousand Barrels) | ||||||||
| Year | Jan | Feb | Mar | Apr | May | Jun | Jul | Aug | Sep | Oct | Nov | Dec |
|---|---|---|---|---|---|---|---|---|---|---|---|---|
| 2005 | 2,265 | 2,290 | 2,533 | 1,940 | 2,053 | 1,921 | 2,116 | 2,053 | 2,093 | 2,099 | 2,263 | 2,319 |
| 2006 | 2,214 | 2,271 | 2,502 | 1,793 | 1,650 | 1,795 | 1,943 | 1,893 | 1,618 | 2,144 | 2,376 | 2,449 |
| 2007 | 2,501 | 2,258 | 2,572 | 2,020 | 2,051 | 2,054 | 2,257 | 2,063 | 2,278 | 2,555 | 2,511 | 2,595 |
| 2008 | 2,990 | 2,750 | 2,538 | 2,426 | 2,749 | 2,564 | 2,512 | 2,603 | 2,597 | 2,832 | 2,797 | 3,155 |
| 2009 | -271 | 19 | -83 | -231 | -420 | -281 | -399 | -411 | -265 | -358 | -447 | -302 |
| 2010 | -141 | -439 | 152 | 134 | 197 | -486 | 328 | -267 | 92 | 440 | -83 | 35 |
| 2011 | 365 | 132 | 736 | 469 | -49 | 17 | 80 | -396 | -538 | -343 | -6 | 67 |
| 2012 | -1,445 | 41 | -315 | -277 | 167 | -298 | 192 | -177 | 195 | 832 | 886 | -793 |
| 2013 | 772 | -170 | 659 | -268 | -416 | -284 | -417 | 130 | 319 | 220 | 419 | -418 |
| 2014 | -408 | -381 | -141 | -339 | -933 | -68 | 315 | 297 | -429 | 490 | 210 | -131 |
| 2015 | 1,304 | 216 | -664 | -49 | -751 | -2 | -64 | 393 | 288 | -343 | -454 | -462 |
| 2016 | 205 | -400 | -62 | 494 | -796 | 52 | -120 | 387 | 509 | -378 | 287 | -469 |
| 2017 | -264 | 786 | -966 | -179 | 184 | -228 | -741 | 1,052 | -390 | -412 | 598 | 51 |
| 2018 | -1,443 | -518 | -1,345 | -299 | -43 | -155 | 1,237 | 354 | -210 | 125 | -1,267 | 158 |
| 2019 | -691 | 458 | -656 | -155 | 277 | -754 | 323 | -254 | 709 | -614 | 788 | -394 |
| 2020 | 517 | 332 | 238 | 218 | 547 | -661 | 29 | 450 | 444 | -238 | -34 | -88 |
| 2021 | 13 | 26 | 209 | 495 | -602 | -537 | 126 | 115 | -154 | 491 | -888 | 38 |
| 2022 | 1,256 | 104 | 542 | -641 | 320 | 530 | -195 | -390 | 982 | 220 | -422 | 577 |
| 2023 | 583 | 623 | -122 | 254 | -428 | -50 | -653 | 938 | -20 | -318 | 4 | 711 |
| 2024 | -316 | |||||||||||
| - = No Data Reported; -- = Not Applicable; NA = Not Available; W = Withheld to avoid disclosure of individual company data. |
| Release Date: 3/29/2024 |
| Next Release Date: 4/30/2024 |