|
Download Data (XLS File) |
|
||||||||
|
||||||||
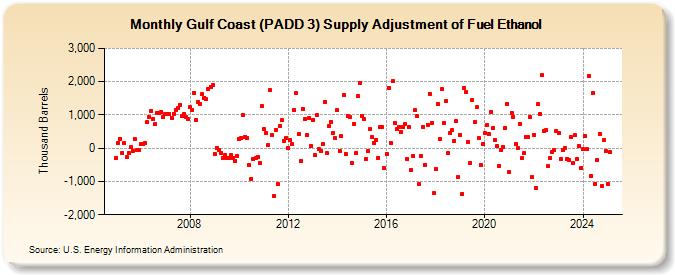
| Gulf Coast (PADD 3) Supply Adjustment of Fuel Ethanol (Thousand Barrels) | ||||||||
| Year | Jan | Feb | Mar | Apr | May | Jun | Jul | Aug | Sep | Oct | Nov | Dec |
|---|---|---|---|---|---|---|---|---|---|---|---|---|
| 2005 | -292 | 159 | 291 | -148 | 157 | -275 | -133 | 22 | -72 | 272 | -59 | -51 |
| 2006 | 115 | 121 | 151 | 778 | 952 | 1,112 | 873 | 713 | 1,070 | 1,055 | 1,096 | 924 |
| 2007 | 1,026 | 1,038 | 1,029 | 918 | 1,036 | 1,140 | 1,193 | 1,307 | 980 | 1,033 | 932 | 879 |
| 2008 | 1,229 | 1,146 | 1,672 | 861 | 1,391 | 1,342 | 1,617 | 1,521 | 1,469 | 1,787 | 1,847 | 1,899 |
| 2009 | -165 | 12 | -52 | -144 | -281 | -209 | -290 | -307 | -199 | -282 | -372 | -232 |
| 2010 | 284 | 310 | 1,008 | 349 | 318 | -518 | -912 | -336 | -306 | -272 | -434 | 1,255 |
| 2011 | 562 | 447 | 87 | 1,756 | 398 | -1,433 | 557 | -1,084 | 676 | 835 | 229 | 309 |
| 2012 | -8 | 242 | 119 | 1,144 | 1,644 | 418 | -399 | 1,186 | 872 | 385 | 905 | 69 |
| 2013 | 862 | -215 | 988 | -20 | -83 | 112 | 1,401 | -156 | 659 | 792 | 465 | 305 |
| 2014 | 1,140 | -76 | 357 | 1,586 | -164 | 958 | 949 | -448 | 734 | -153 | 1,561 | 1,949 |
| 2015 | 974 | 884 | -338 | -98 | 581 | 332 | 157 | 256 | -282 | 636 | 642 | -607 |
| 2016 | -170 | 1,819 | 164 | 2,009 | 759 | 569 | 644 | 496 | 649 | 740 | -312 | 627 |
| 2017 | -661 | -221 | 1,140 | 964 | -1,086 | -228 | 632 | -498 | 705 | 1,637 | 770 | -1,361 |
| 2018 | -622 | 1,340 | 276 | 1,778 | 769 | 1,412 | -155 | 457 | 535 | 221 | 803 | -860 |
| 2019 | 393 | -1,364 | 1,802 | 1,685 | 194 | -433 | 1,452 | 791 | 1,228 | 297 | -504 | 117 |
| 2020 | 461 | 704 | 427 | 1,092 | 613 | 236 | 64 | -543 | -62 | 29 | 618 | 1,333 |
| 2021 | -711 | 1,059 | 944 | 119 | -8 | 734 | -303 | -158 | 335 | 329 | 940 | -873 |
| 2022 | 403 | -1,188 | 1,317 | 1,034 | 2,191 | 515 | 545 | -546 | -288 | -116 | -49 | 510 |
| 2023 | 407 | -424 | 208 | 107 | -259 | -376 | 305 | -470 | 432 | -380 | 129 | -615 |
| 2024 | -33 | 355 | -30 | 2,552 | ||||||||
| - = No Data Reported; -- = Not Applicable; NA = Not Available; W = Withheld to avoid disclosure of individual company data. |
| Release Date: 6/28/2024 |
| Next Release Date: 7/31/2024 |