|
Download Data (XLS File) |
|
||||||||
|
||||||||
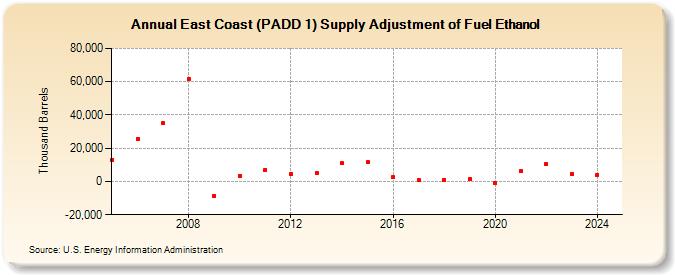
| East Coast (PADD 1) Supply Adjustment of Fuel Ethanol (Thousand Barrels) | ||||||||
| Decade | Year-0 | Year-1 | Year-2 | Year-3 | Year-4 | Year-5 | Year-6 | Year-7 | Year-8 | Year-9 |
|---|---|---|---|---|---|---|---|---|---|---|
| 2000's | 13,013 | 25,674 | 35,125 | 61,487 | -8,651 | |||||
| 2010's | 3,487 | 6,932 | 4,545 | 5,055 | 10,793 | 11,646 | 2,493 | 643 | 909 | 1,407 |
| 2020's | -994 | 5,990 | 10,626 | 4,857 |
| - = No Data Reported; -- = Not Applicable; NA = Not Available; W = Withheld to avoid disclosure of individual company data. |
| Release Date: 3/29/2024 |
| Next Release Date: 8/30/2024 |