|
Download Data (XLS File) |
|
||||||||
|
||||||||
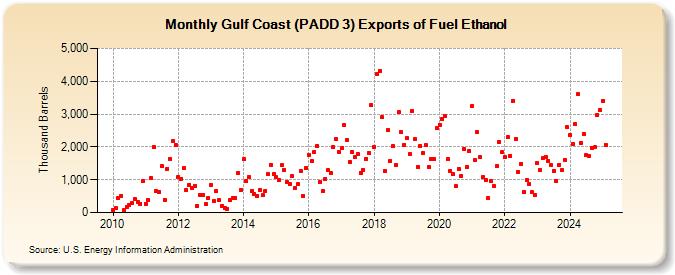
| Gulf Coast (PADD 3) Exports of Fuel Ethanol (Thousand Barrels) | ||||||||
| Year | Jan | Feb | Mar | Apr | May | Jun | Jul | Aug | Sep | Oct | Nov | Dec |
|---|---|---|---|---|---|---|---|---|---|---|---|---|
| 2010 | 84 | 128 | 455 | 507 | 76 | 172 | 219 | 284 | 420 | 332 | 275 | 955 |
| 2011 | 271 | 391 | 1,060 | 1,991 | 658 | 634 | 1,416 | 385 | 1,339 | 1,635 | 2,165 | 2,068 |
| 2012 | 1,092 | 1,036 | 1,342 | 702 | 854 | 751 | 814 | 213 | 543 | 542 | 249 | 441 |
| 2013 | 852 | 354 | 652 | 390 | 215 | 139 | 119 | 384 | 444 | 445 | 1,203 | 691 |
| 2014 | 1,625 | 954 | 1,086 | 652 | 569 | 513 | 693 | 522 | 666 | 1,161 | 1,458 | 1,171 |
| 2015 | 1,074 | 995 | 1,434 | 1,289 | 942 | 861 | 1,102 | 745 | 862 | 1,270 | 510 | 1,366 |
| 2016 | 1,768 | 1,568 | 1,848 | 2,041 | 935 | 647 | 1,030 | 1,281 | 1,198 | 1,992 | 2,226 | 1,842 |
| 2017 | 1,953 | 2,661 | 2,203 | 1,552 | 1,851 | 1,701 | 1,777 | 1,214 | 1,301 | 1,639 | 1,825 | 3,265 |
| 2018 | 2,007 | 4,222 | 4,304 | 2,910 | 1,273 | 2,500 | 1,572 | 2,023 | 1,453 | 3,052 | 2,445 | 2,072 |
| 2019 | 2,257 | 1,785 | 3,096 | 2,227 | 1,389 | 2,028 | 1,815 | 2,044 | 1,400 | 1,619 | 1,620 | 2,575 |
| 2020 | 2,667 | 2,847 | 2,939 | 1,628 | 1,259 | 1,168 | 803 | 1,333 | 1,117 | 1,943 | 1,382 | 1,876 |
| 2021 | 3,248 | 1,600 | 2,440 | 1,690 | 1,070 | 994 | 431 | 956 | 805 | 1,415 | 2,161 | 1,834 |
| 2022 | 1,681 | 2,289 | 1,732 | 3,406 | 2,255 | 1,241 | 1,482 | 628 | 990 | 877 | 615 | 545 |
| 2023 | 1,505 | 1,209 | 1,903 | 1,812 | 1,592 | 1,447 | 1,244 | 939 | 1,462 | 1,282 | 1,604 | 2,595 |
| 2024 | 2,362 | |||||||||||
| - = No Data Reported; -- = Not Applicable; NA = Not Available; W = Withheld to avoid disclosure of individual company data. |
| Release Date: 3/29/2024 |
| Next Release Date: 4/30/2024 |