|
Download Data (XLS File) |
|
||||||||
|
||||||||
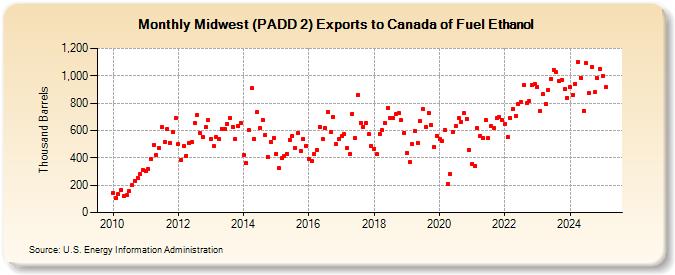
| Midwest (PADD 2) Exports to Canada of Fuel Ethanol (Thousand Barrels) | ||||||||
| Year | Jan | Feb | Mar | Apr | May | Jun | Jul | Aug | Sep | Oct | Nov | Dec |
|---|---|---|---|---|---|---|---|---|---|---|---|---|
| 2010 | 143 | 104 | 133 | 166 | 121 | 125 | 157 | 198 | 234 | 253 | 279 | 314 |
| 2011 | 301 | 319 | 392 | 495 | 421 | 474 | 624 | 518 | 608 | 511 | 590 | 692 |
| 2012 | 501 | 384 | 486 | 416 | 508 | 514 | 656 | 716 | 582 | 553 | 623 | 676 |
| 2013 | 541 | 483 | 551 | 538 | 614 | 608 | 650 | 692 | 628 | 539 | 630 | 655 |
| 2014 | 419 | 361 | 601 | 908 | 539 | 734 | 619 | 675 | 568 | 405 | 519 | 545 |
| 2015 | 427 | 323 | 398 | 410 | 430 | 531 | 561 | 474 | 581 | 449 | 536 | 489 |
| 2016 | 395 | 377 | 430 | 459 | 626 | 538 | 617 | 736 | 587 | 700 | 500 | 535 |
| 2017 | 556 | 573 | 473 | 429 | 724 | 548 | 861 | 656 | 629 | 657 | 571 | 487 |
| 2018 | 468 | 425 | 572 | 600 | 653 | 764 | 688 | 691 | 718 | 727 | 675 | 584 |
| 2019 | 437 | 371 | 500 | 598 | 511 | 669 | 754 | 626 | 731 | 639 | 479 | 562 |
| 2020 | 537 | 524 | 606 | 207 | 281 | 586 | 631 | 688 | 661 | 725 | 687 | 456 |
| 2021 | 357 | 339 | 615 | 562 | 543 | 674 | 544 | 630 | 617 | 691 | 695 | 676 |
| 2022 | 644 | 551 | 691 | 755 | 705 | 792 | 809 | 931 | 798 | 815 | 935 | 940 |
| 2023 | 941 | 766 | 888 | 801 | 912 | 999 | 1,061 | 1,042 | 976 | 990 | 928 | 847 |
| 2024 | 917 | |||||||||||
| - = No Data Reported; -- = Not Applicable; NA = Not Available; W = Withheld to avoid disclosure of individual company data. |
| Release Date: 3/29/2024 |
| Next Release Date: 4/30/2024 |