|
Download Data (XLS File) |
|
||||||||
|
||||||||
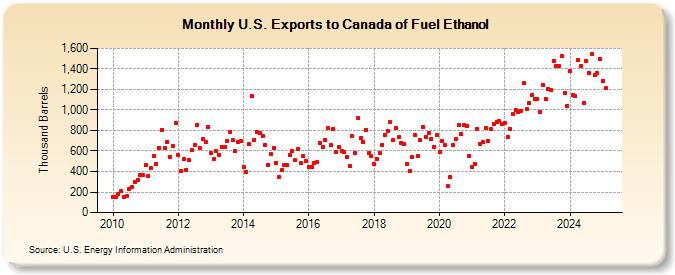
| U.S. Exports to Canada of Fuel Ethanol (Thousand Barrels) | ||||||||
| Year | Jan | Feb | Mar | Apr | May | Jun | Jul | Aug | Sep | Oct | Nov | Dec |
|---|---|---|---|---|---|---|---|---|---|---|---|---|
| 2010 | 156 | 153 | 181 | 210 | 154 | 161 | 226 | 247 | 301 | 318 | 369 | 367 |
| 2011 | 461 | 357 | 430 | 547 | 472 | 629 | 806 | 628 | 689 | 546 | 645 | 875 |
| 2012 | 557 | 404 | 519 | 418 | 514 | 605 | 658 | 855 | 630 | 716 | 690 | 836 |
| 2013 | 578 | 519 | 597 | 558 | 642 | 636 | 702 | 785 | 706 | 603 | 686 | 699 |
| 2014 | 444 | 398 | 667 | 1,135 | 712 | 783 | 778 | 749 | 657 | 466 | 567 | 630 |
| 2015 | 485 | 346 | 412 | 459 | 460 | 558 | 597 | 510 | 622 | 479 | 553 | 507 |
| 2016 | 445 | 444 | 487 | 492 | 682 | 635 | 705 | 824 | 658 | 819 | 587 | 643 |
| 2017 | 597 | 590 | 541 | 452 | 746 | 582 | 922 | 724 | 687 | 807 | 577 | 551 |
| 2018 | 469 | 526 | 584 | 659 | 758 | 794 | 878 | 704 | 821 | 732 | 677 | 668 |
| 2019 | 475 | 406 | 539 | 757 | 551 | 703 | 832 | 741 | 771 | 716 | 639 | 755 |
| 2020 | 590 | 700 | 655 | 258 | 349 | 654 | 717 | 855 | 765 | 849 | 847 | 548 |
| 2021 | 441 | 477 | 818 | 664 | 687 | 822 | 696 | 810 | 863 | 887 | 892 | 866 |
| 2022 | 877 | 741 | 815 | 956 | 997 | 981 | 993 | 1,262 | 1,007 | 1,067 | 1,146 | 1,106 |
| 2023 | 1,133 | 1,006 | 1,349 | 1,119 | 1,218 | 1,213 | 1,493 | 1,488 | 1,441 | 1,541 | 1,194 | 1,041 |
| 2024 | 1,377 | |||||||||||
| - = No Data Reported; -- = Not Applicable; NA = Not Available; W = Withheld to avoid disclosure of individual company data. |
| Release Date: 3/29/2024 |
| Next Release Date: 4/30/2024 |