|
Download Data (XLS File) |
|
|||||
|
|||||
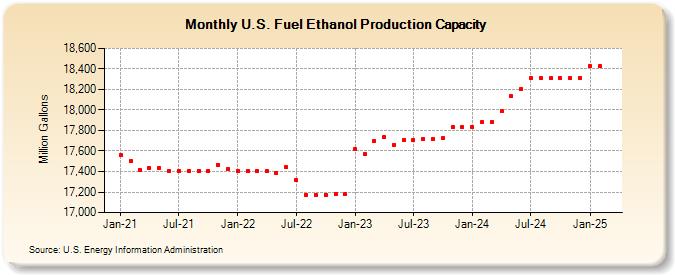
| U.S. Fuel Ethanol Production Capacity (Million Gallons) | |||||
| Year | Jan | Feb | Mar | Apr | May | Jun | Jul | Aug | Sep | Oct | Nov | Dec |
|---|---|---|---|---|---|---|---|---|---|---|---|---|
| 2021 | 17,557 | 17,502 | 17,416 | 17,436 | 17,436 | 17,408 | 17,408 | 17,408 | 17,408 | 17,408 | 17,467 | 17,425 |
| 2022 | 17,403 | 17,403 | 17,403 | 17,403 | 17,381 | 17,441 | 17,314 | 17,175 | 17,175 | 17,175 | 17,177 | 17,177 |
| 2023 | 17,219 | 17,395 | 17,734 | 17,770 | 17,700 | 17,707 | 17,709 | 17,719 | 17,721 | 17,721 | 17,829 | 17,829 |
| 2024 | 17,830 | |||||||||||
| - = No Data Reported; -- = Not Applicable; NA = Not Available; W = Withheld to avoid disclosure of individual company data. |
| Release Date: 3/29/2024 |
| Next Release Date: 4/30/2024 |
Referring Pages: