|
Download Data (XLS File) |
|
||||||||
|
||||||||
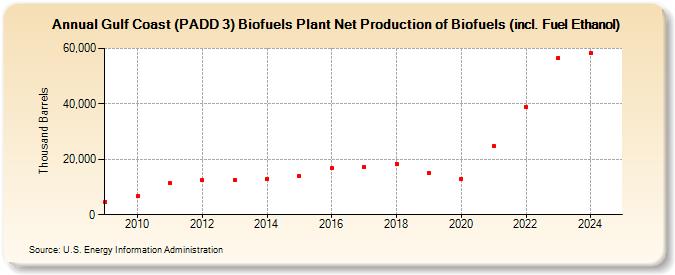
| Gulf Coast (PADD 3) Biofuels Plant Net Production of Biofuels (incl. Fuel Ethanol) (Thousand Barrels) | ||||||||
| Decade | Year-0 | Year-1 | Year-2 | Year-3 | Year-4 | Year-5 | Year-6 | Year-7 | Year-8 | Year-9 |
|---|---|---|---|---|---|---|---|---|---|---|
| 2000's | 4,741 | |||||||||
| 2010's | 6,688 | 11,365 | 12,402 | 12,697 | 12,917 | 13,931 | 16,713 | 17,296 | 18,466 | 15,187 |
| 2020's | 12,996 | 24,706 | 38,824 | 56,753 |
| - = No Data Reported; -- = Not Applicable; NA = Not Available; W = Withheld to avoid disclosure of individual company data. |
| Release Date: 3/29/2024 |
| Next Release Date: 8/30/2024 |