|
Download Data (XLS File) |
|
||||||||
|
||||||||
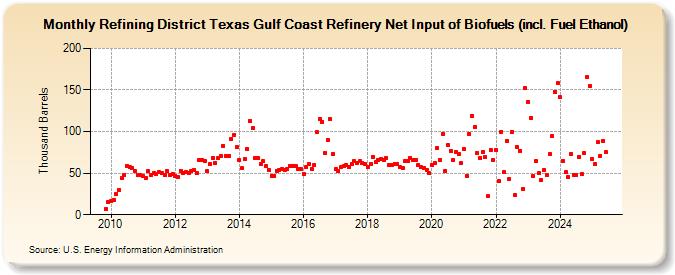
| Refining District Texas Gulf Coast Refinery Net Input of Biofuels (incl. Fuel Ethanol) (Thousand Barrels) | ||||||||
| Year | Jan | Feb | Mar | Apr | May | Jun | Jul | Aug | Sep | Oct | Nov | Dec |
|---|---|---|---|---|---|---|---|---|---|---|---|---|
| 2009 | 7 | 15 | ||||||||||
| 2010 | 16 | 18 | 25 | 30 | 44 | 48 | 59 | 57 | 56 | 52 | 48 | 48 |
| 2011 | 46 | 44 | 52 | 48 | 50 | 49 | 51 | 50 | 48 | 52 | 48 | 49 |
| 2012 | 47 | 45 | 53 | 50 | 51 | 50 | 52 | 54 | 50 | 66 | 66 | 65 |
| 2013 | 52 | 61 | 68 | 62 | 68 | 71 | 83 | 71 | 71 | 91 | 96 | 81 |
| 2014 | 66 | 56 | 67 | 79 | 113 | 104 | 68 | 68 | 61 | 64 | 58 | 54 |
| 2015 | 47 | 47 | 53 | 54 | 55 | 54 | 55 | 59 | 58 | 59 | 55 | 55 |
| 2016 | 49 | 57 | 61 | 55 | 60 | 99 | 115 | 112 | 74 | 90 | 115 | 73 |
| 2017 | 55 | 53 | 57 | 58 | 60 | 57 | 61 | 64 | 62 | 64 | 62 | 61 |
| 2018 | 57 | 61 | 70 | 63 | 66 | 67 | 66 | 68 | 60 | 60 | 61 | 61 |
| 2019 | 57 | 56 | 64 | 64 | 68 | 66 | 66 | 60 | 57 | 56 | 54 | 50 |
| 2020 | 60 | 62 | 80 | 66 | 97 | 53 | 84 | 77 | 66 | 76 | 73 | 62 |
| 2021 | 79 | 47 | 97 | 119 | 106 | 74 | 68 | 75 | 69 | 22 | 78 | 66 |
| 2022 | 78 | 40 | 100 | 51 | 89 | 43 | 100 | 24 | 81 | 77 | 31 | 152 |
| 2023 | 136 | 116 | 46 | 64 | 50 | 42 | 54 | 48 | 73 | 95 | 148 | 158 |
| 2024 | 141 | |||||||||||
| - = No Data Reported; -- = Not Applicable; NA = Not Available; W = Withheld to avoid disclosure of individual company data. |
| Release Date: 3/29/2024 |
| Next Release Date: 4/30/2024 |