|
Download Data (XLS File) |
|
||||||||
|
||||||||
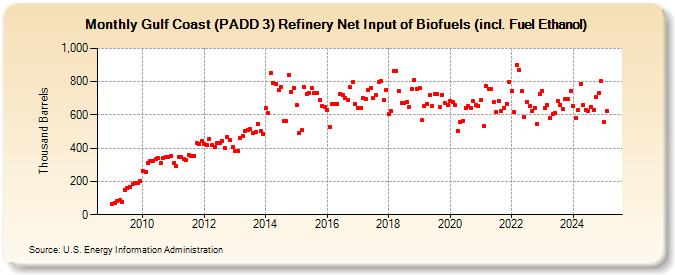
| Gulf Coast (PADD 3) Refinery Net Input of Biofuels (incl. Fuel Ethanol) (Thousand Barrels) | ||||||||
| Year | Jan | Feb | Mar | Apr | May | Jun | Jul | Aug | Sep | Oct | Nov | Dec |
|---|---|---|---|---|---|---|---|---|---|---|---|---|
| 2009 | 64 | 70 | 82 | 86 | 78 | 149 | 159 | 166 | 187 | 191 | 192 | 200 |
| 2010 | 263 | 258 | 311 | 322 | 324 | 332 | 340 | 308 | 343 | 348 | 345 | 356 |
| 2011 | 309 | 292 | 350 | 346 | 335 | 326 | 360 | 354 | 354 | 431 | 426 | 442 |
| 2012 | 427 | 419 | 457 | 418 | 410 | 429 | 434 | 445 | 403 | 469 | 447 | 406 |
| 2013 | 384 | 385 | 463 | 471 | 506 | 507 | 516 | 494 | 498 | 545 | 503 | 483 |
| 2014 | 640 | 610 | 854 | 794 | 783 | 748 | 768 | 564 | 563 | 841 | 739 | 764 |
| 2015 | 659 | 490 | 507 | 765 | 724 | 730 | 764 | 730 | 730 | 692 | 651 | 647 |
| 2016 | 632 | 530 | 663 | 665 | 668 | 728 | 722 | 704 | 692 | 766 | 797 | 667 |
| 2017 | 639 | 642 | 701 | 698 | 750 | 764 | 700 | 720 | 795 | 802 | 688 | 750 |
| 2018 | 603 | 623 | 864 | 867 | 742 | 672 | 674 | 678 | 646 | 758 | 810 | 756 |
| 2019 | 759 | 567 | 651 | 668 | 719 | 654 | 726 | 723 | 650 | 720 | 671 | 659 |
| 2020 | 684 | 680 | 659 | 506 | 560 | 565 | 643 | 656 | 643 | 681 | 657 | 656 |
| 2021 | 689 | 531 | 774 | 758 | 757 | 676 | 616 | 682 | 625 | 639 | 668 | 798 |
| 2022 | 744 | 620 | 901 | 872 | 742 | 587 | 680 | 652 | 623 | 644 | 545 | 727 |
| 2023 | 718 | 640 | 658 | 582 | 604 | 611 | 682 | 643 | 634 | 697 | 697 | 746 |
| 2024 | 654 | |||||||||||
| - = No Data Reported; -- = Not Applicable; NA = Not Available; W = Withheld to avoid disclosure of individual company data. |
| Release Date: 3/29/2024 |
| Next Release Date: 4/30/2024 |