|
Download Data (XLS File) |
|
||||||||
|
||||||||
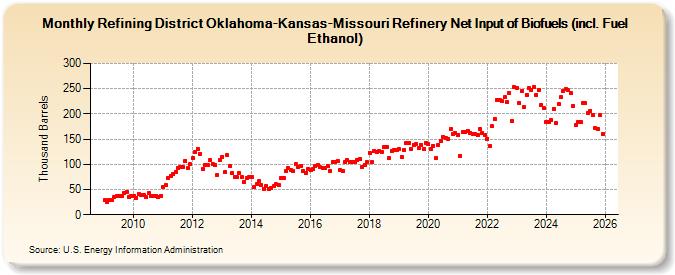
| Refining District Oklahoma-Kansas-Missouri Refinery Net Input of Biofuels (incl. Fuel Ethanol) (Thousand Barrels) | ||||||||
| Year | Jan | Feb | Mar | Apr | May | Jun | Jul | Aug | Sep | Oct | Nov | Dec |
|---|---|---|---|---|---|---|---|---|---|---|---|---|
| 2009 | 29 | 26 | 29 | 30 | 35 | 37 | 38 | 37 | 43 | 45 | 36 | 38 |
| 2010 | 38 | 34 | 41 | 39 | 39 | 35 | 43 | 38 | 37 | 38 | 35 | 38 |
| 2011 | 55 | 58 | 73 | 77 | 80 | 85 | 93 | 95 | 95 | 107 | 93 | 100 |
| 2012 | 112 | 125 | 131 | 121 | 90 | 99 | 98 | 108 | 101 | 99 | 79 | 108 |
| 2013 | 115 | 84 | 118 | 96 | 82 | 75 | 74 | 82 | 74 | 65 | 73 | 74 |
| 2014 | 75 | 55 | 60 | 66 | 59 | 52 | 56 | 51 | 53 | 56 | 60 | 59 |
| 2015 | 73 | 72 | 86 | 93 | 89 | 86 | 100 | 94 | 97 | 87 | 83 | 91 |
| 2016 | 89 | 90 | 97 | 99 | 94 | 92 | 92 | 96 | 87 | 105 | 104 | 107 |
| 2017 | 89 | 86 | 105 | 108 | 105 | 105 | 104 | 109 | 110 | 95 | 99 | 104 |
| 2018 | 123 | 104 | 127 | 125 | 126 | 125 | 134 | 134 | 112 | 127 | 128 | 129 |
| 2019 | 130 | 114 | 129 | 142 | 143 | 131 | 139 | 140 | 132 | 139 | 130 | 143 |
| 2020 | 140 | 131 | 137 | 112 | 139 | 147 | 155 | 153 | 151 | 170 | 160 | 162 |
| 2021 | 159 | 117 | 164 | 164 | 167 | 163 | 161 | 160 | 158 | 170 | 162 | 159 |
| 2022 | 151 | 136 | 175 | 190 | 228 | 228 | 225 | 233 | 224 | 241 | 186 | 253 |
| 2023 | 252 | 222 | 245 | 214 | 238 | 251 | 247 | 253 | 238 | 247 | 218 | 211 |
| 2024 | 184 | 184 | 187 | 210 | 181 | 220 | ||||||
| - = No Data Reported; -- = Not Applicable; NA = Not Available; W = Withheld to avoid disclosure of individual company data. |
| Release Date: 8/30/2024 |
| Next Release Date: 9/30/2024 |