|
Download Data (XLS File) |
|
||||||||
|
||||||||
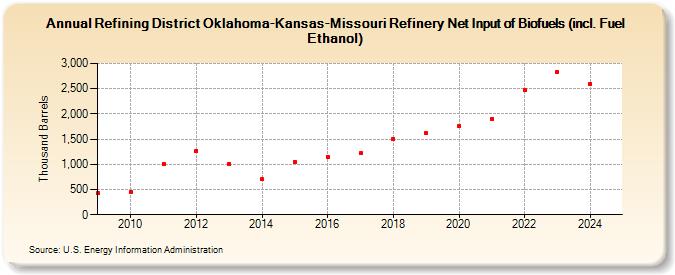
| Refining District Oklahoma-Kansas-Missouri Refinery Net Input of Biofuels (incl. Fuel Ethanol) (Thousand Barrels) | ||||||||
| Decade | Year-0 | Year-1 | Year-2 | Year-3 | Year-4 | Year-5 | Year-6 | Year-7 | Year-8 | Year-9 |
|---|---|---|---|---|---|---|---|---|---|---|
| 2000's | 423 | |||||||||
| 2010's | 455 | 1,011 | 1,271 | 1,012 | 702 | 1,051 | 1,152 | 1,219 | 1,494 | 1,612 |
| 2020's | 1,757 | 1,904 | 2,470 | 2,836 |
| - = No Data Reported; -- = Not Applicable; NA = Not Available; W = Withheld to avoid disclosure of individual company data. |
| Release Date: 6/28/2024 |
| Next Release Date: 8/30/2024 |