|
Download Data (XLS File) |
|
||||||||
|
||||||||
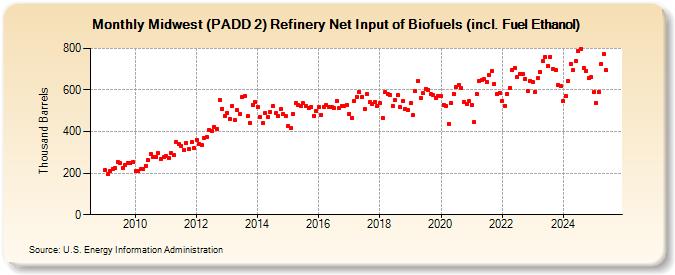
| Midwest (PADD 2) Refinery Net Input of Biofuels (incl. Fuel Ethanol) (Thousand Barrels) | ||||||||
| Year | Jan | Feb | Mar | Apr | May | Jun | Jul | Aug | Sep | Oct | Nov | Dec |
|---|---|---|---|---|---|---|---|---|---|---|---|---|
| 2009 | 214 | 195 | 210 | 222 | 224 | 255 | 247 | 227 | 240 | 251 | 248 | 252 |
| 2010 | 212 | 210 | 218 | 219 | 236 | 263 | 293 | 279 | 278 | 296 | 267 | 276 |
| 2011 | 281 | 273 | 297 | 286 | 352 | 340 | 331 | 310 | 347 | 314 | 348 | 321 |
| 2012 | 361 | 341 | 337 | 371 | 372 | 408 | 404 | 423 | 414 | 552 | 510 | 474 |
| 2013 | 491 | 459 | 525 | 455 | 503 | 486 | 568 | 570 | 473 | 443 | 530 | 541 |
| 2014 | 520 | 469 | 439 | 489 | 470 | 495 | 523 | 487 | 476 | 507 | 485 | 474 |
| 2015 | 427 | 415 | 485 | 537 | 527 | 521 | 536 | 523 | 515 | 517 | 475 | 501 |
| 2016 | 519 | 482 | 519 | 528 | 519 | 520 | 513 | 548 | 513 | 525 | 523 | 530 |
| 2017 | 486 | 467 | 548 | 565 | 591 | 567 | 508 | 583 | 540 | 534 | 540 | 524 |
| 2018 | 535 | 467 | 590 | 581 | 576 | 523 | 551 | 574 | 518 | 547 | 509 | 506 |
| 2019 | 535 | 479 | 595 | 642 | 562 | 584 | 607 | 602 | 579 | 574 | 562 | 571 |
| 2020 | 572 | 530 | 524 | 438 | 538 | 582 | 614 | 625 | 608 | 543 | 533 | 545 |
| 2021 | 529 | 447 | 580 | 643 | 648 | 651 | 640 | 673 | 690 | 629 | 580 | 586 |
| 2022 | 549 | 524 | 583 | 611 | 696 | 708 | 664 | 679 | 678 | 653 | 593 | 644 |
| 2023 | 640 | 591 | 657 | 688 | 739 | 760 | 715 | 759 | 702 | 694 | 626 | 617 |
| 2024 | 548 | 571 | 643 | 727 | ||||||||
| - = No Data Reported; -- = Not Applicable; NA = Not Available; W = Withheld to avoid disclosure of individual company data. |
| Release Date: 6/28/2024 |
| Next Release Date: 7/31/2024 |