|
Download Data (XLS File) |
|
||||||||
|
||||||||
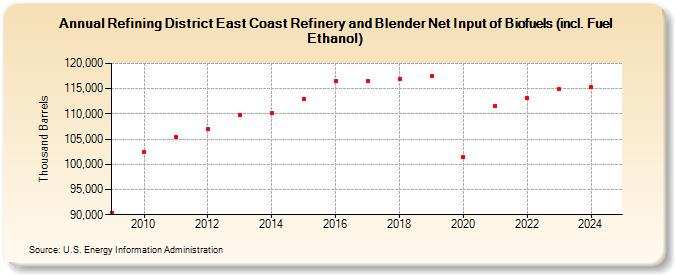
| Refining District East Coast Refinery and Blender Net Input of Biofuels (incl. Fuel Ethanol) (Thousand Barrels) | ||||||||
| Decade | Year-0 | Year-1 | Year-2 | Year-3 | Year-4 | Year-5 | Year-6 | Year-7 | Year-8 | Year-9 |
|---|---|---|---|---|---|---|---|---|---|---|
| 2000's | 90,244 | |||||||||
| 2010's | 102,442 | 105,510 | 106,931 | 109,833 | 110,130 | 113,022 | 116,523 | 116,607 | 116,953 | 117,485 |
| 2020's | 101,411 | 111,587 | 113,094 | 114,871 |
| - = No Data Reported; -- = Not Applicable; NA = Not Available; W = Withheld to avoid disclosure of individual company data. |
| Release Date: 6/28/2024 |
| Next Release Date: 8/30/2024 |