|
Download Data (XLS File) |
|
||||||||
|
||||||||
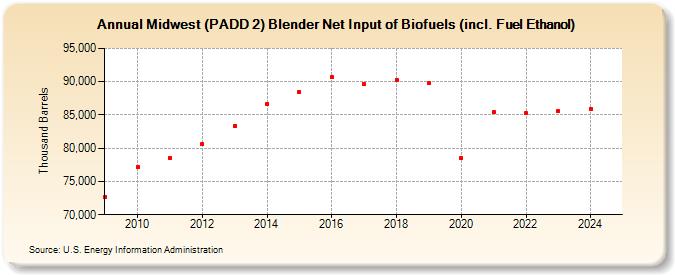
| Midwest (PADD 2) Blender Net Input of Biofuels (incl. Fuel Ethanol) (Thousand Barrels) | ||||||||
| Decade | Year-0 | Year-1 | Year-2 | Year-3 | Year-4 | Year-5 | Year-6 | Year-7 | Year-8 | Year-9 |
|---|---|---|---|---|---|---|---|---|---|---|
| 2000's | 72,659 | |||||||||
| 2010's | 77,203 | 78,586 | 80,640 | 83,376 | 86,669 | 88,418 | 90,638 | 89,587 | 90,274 | 89,724 |
| 2020's | 78,545 | 85,432 | 85,241 | 85,555 |
| - = No Data Reported; -- = Not Applicable; NA = Not Available; W = Withheld to avoid disclosure of individual company data. |
| Release Date: 6/28/2024 |
| Next Release Date: 8/30/2024 |