|
Download Data (XLS File) |
|
||||||||
|
||||||||
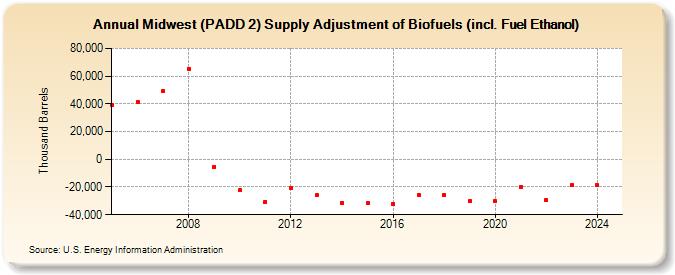
| Midwest (PADD 2) Supply Adjustment of Biofuels (incl. Fuel Ethanol) (Thousand Barrels) | ||||||||
| Decade | Year-0 | Year-1 | Year-2 | Year-3 | Year-4 | Year-5 | Year-6 | Year-7 | Year-8 | Year-9 |
|---|---|---|---|---|---|---|---|---|---|---|
| 2000's | 39,453 | 41,623 | 49,299 | 65,336 | -5,332 | |||||
| 2010's | -22,362 | -30,604 | -20,558 | -25,778 | -31,367 | -31,815 | -32,249 | -25,476 | -25,681 | -30,388 |
| 2020's | -30,232 | -19,782 | -29,560 | -19,901 |
| - = No Data Reported; -- = Not Applicable; NA = Not Available; W = Withheld to avoid disclosure of individual company data. |
| Release Date: 3/29/2024 |
| Next Release Date: 8/30/2024 |