|
Download Data (XLS File) |
|
||||||||
|
||||||||
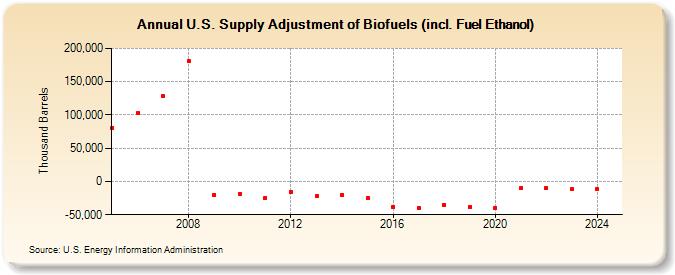
| U.S. Supply Adjustment of Biofuels (incl. Fuel Ethanol) (Thousand Barrels) | ||||||||
| Decade | Year-0 | Year-1 | Year-2 | Year-3 | Year-4 | Year-5 | Year-6 | Year-7 | Year-8 | Year-9 |
|---|---|---|---|---|---|---|---|---|---|---|
| 2000's | 80,415 | 102,987 | 127,921 | 181,165 | -19,825 | |||||
| 2010's | -18,460 | -24,520 | -15,121 | -22,599 | -19,757 | -25,124 | -37,868 | -39,640 | -34,700 | -37,909 |
| 2020's | -39,217 | -10,263 | -10,169 | -11,924 | -11,799 |
| - = No Data Reported; -- = Not Applicable; NA = Not Available; W = Withheld to avoid disclosure of individual company data. |
| Release Date: 6/30/2025 |
| Next Release Date: 8/29/2025 |