|
Download Data (XLS File) |
|
||||||||
|
||||||||
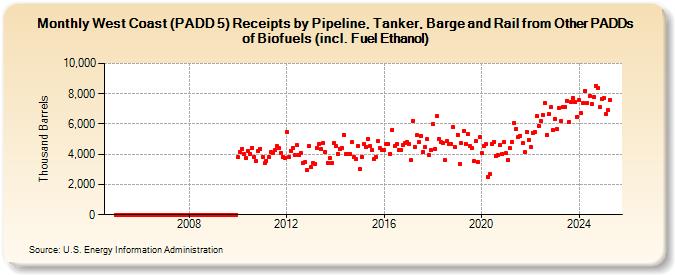
| West Coast (PADD 5) Receipts by Pipeline, Tanker, Barge and Rail from Other PADDs of Biofuels (incl. Fuel Ethanol) (Thousand Barrels) | ||||||||
| Year | Jan | Feb | Mar | Apr | May | Jun | Jul | Aug | Sep | Oct | Nov | Dec |
|---|---|---|---|---|---|---|---|---|---|---|---|---|
| 2005 | 0 | 0 | 0 | 0 | 0 | 0 | 0 | 0 | 0 | 0 | 0 | 0 |
| 2006 | 0 | 0 | 0 | 0 | 0 | 0 | 0 | 0 | 0 | 0 | 0 | 0 |
| 2007 | 0 | 0 | 0 | 0 | 0 | 0 | 0 | 0 | 0 | 0 | 0 | 0 |
| 2008 | 0 | 0 | 0 | 0 | 0 | 0 | 0 | 0 | 0 | 0 | 0 | 0 |
| 2009 | 0 | 0 | 0 | 4 | 0 | 0 | 0 | 0 | 0 | 0 | 0 | 0 |
| 2010 | 3,815 | 4,150 | 4,369 | 4,012 | 3,734 | 4,226 | 4,047 | 4,440 | 3,788 | 3,538 | 4,236 | 4,367 |
| 2011 | 3,831 | 3,411 | 3,576 | 3,788 | 4,115 | 4,051 | 4,305 | 4,538 | 4,385 | 4,091 | 3,827 | 3,769 |
| 2012 | 5,449 | 3,816 | 4,224 | 4,427 | 3,964 | 4,580 | 3,934 | 4,082 | 3,424 | 3,457 | 2,959 | 4,533 |
| 2013 | 3,136 | 3,424 | 3,339 | 4,384 | 4,661 | 4,319 | 4,775 | 4,168 | 3,409 | 3,763 | 3,418 | 4,752 |
| 2014 | 4,530 | 4,046 | 4,344 | 4,424 | 5,295 | 3,998 | 4,032 | 4,019 | 4,790 | 3,823 | 3,688 | 4,563 |
| 2015 | 3,018 | 3,840 | 4,698 | 4,454 | 4,993 | 4,513 | 4,293 | 3,663 | 3,842 | 4,850 | 4,389 | 4,299 |
| 2016 | 4,294 | 4,680 | 4,666 | 4,028 | 5,618 | 4,528 | 4,647 | 4,283 | 4,269 | 4,600 | 4,712 | 4,790 |
| 2017 | 4,680 | 3,590 | 6,222 | 4,483 | 5,239 | 4,776 | 5,194 | 4,166 | 4,471 | 4,996 | 3,923 | 4,257 |
| 2018 | 5,989 | 4,365 | 6,506 | 5,005 | 4,801 | 4,717 | 3,604 | 4,850 | 4,695 | 4,669 | 5,769 | 4,446 |
| 2019 | 5,304 | 3,374 | 4,709 | 5,535 | 4,695 | 5,310 | 4,550 | 4,379 | 3,524 | 4,852 | 3,455 | 5,121 |
| 2020 | 4,054 | 4,532 | 4,643 | 2,506 | 2,662 | 4,699 | 4,841 | 3,876 | 3,926 | 4,624 | 4,047 | 4,832 |
| 2021 | 4,064 | 3,614 | 4,402 | 4,806 | 6,062 | 5,700 | 5,120 | 5,231 | 4,733 | 4,145 | 5,470 | 4,944 |
| 2022 | 4,501 | 5,430 | 5,467 | 6,500 | 5,899 | 6,203 | 6,619 | 7,396 | 5,274 | 6,630 | 7,096 | 5,601 |
| 2023 | 6,353 | 5,635 | 7,057 | 6,197 | 7,127 | 7,140 | 7,546 | 6,150 | 7,443 | 7,711 | 7,438 | 6,479 |
| 2024 | 7,592 | 6,693 | 7,391 | 8,212 | 7,412 | 7,824 | 7,335 | 7,777 | 8,531 | 8,392 | 7,103 | 7,661 |
| 2025 | 7,726 | 6,669 | 6,904 | 7,613 | ||||||||
| - = No Data Reported; -- = Not Applicable; NA = Not Available; W = Withheld to avoid disclosure of individual company data. |
| Release Date: 6/30/2025 |
| Next Release Date: 7/31/2025 |
Referring Pages: