|
Download Data (XLS File) |
|
||||||||
|
||||||||
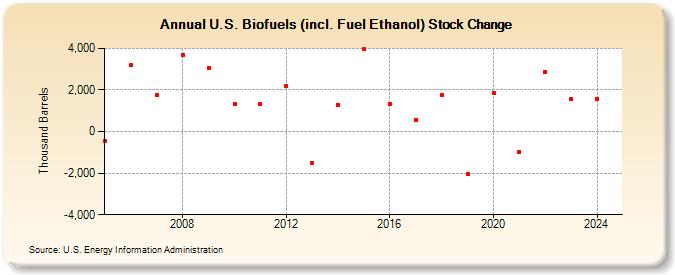
| U.S. Biofuels (incl. Fuel Ethanol) Stock Change (Thousand Barrels) | ||||||||
| Decade | Year-0 | Year-1 | Year-2 | Year-3 | Year-4 | Year-5 | Year-6 | Year-7 | Year-8 | Year-9 |
|---|---|---|---|---|---|---|---|---|---|---|
| 2000's | -439 | 3,197 | 1,775 | 3,691 | 3,079 | |||||
| 2010's | 1,308 | 1,332 | 2,184 | -1,504 | 1,297 | 3,951 | 1,336 | 578 | 1,769 | -2,062 |
| 2020's | 1,843 | -984 | 2,882 | 1,486 |
| - = No Data Reported; -- = Not Applicable; NA = Not Available; W = Withheld to avoid disclosure of individual company data. |
| Release Date: 3/29/2024 |
| Next Release Date: 8/30/2024 |