|
Download Data (XLS File) |
|
||||||||
|
||||||||
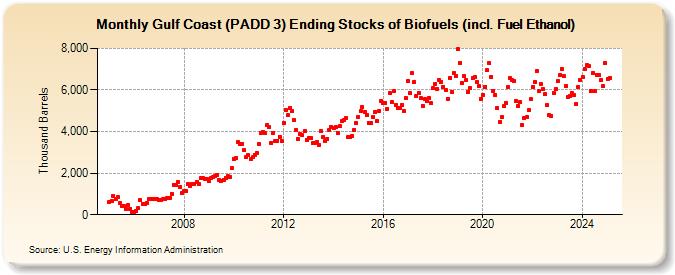
| Gulf Coast (PADD 3) Ending Stocks of Biofuels (incl. Fuel Ethanol) (Thousand Barrels) | ||||||||
| Year | Jan | Feb | Mar | Apr | May | Jun | Jul | Aug | Sep | Oct | Nov | Dec |
|---|---|---|---|---|---|---|---|---|---|---|---|---|
| 2005 | 618 | 681 | 903 | 734 | 868 | 565 | 412 | 405 | 282 | 459 | 291 | 134 |
| 2006 | 138 | 156 | 305 | 703 | 539 | 516 | 576 | 742 | 767 | 734 | 752 | 735 |
| 2007 | 713 | 699 | 734 | 745 | 797 | 809 | 1,003 | 1,436 | 1,426 | 1,570 | 1,314 | 1,030 |
| 2008 | 1,139 | 1,137 | 1,468 | 1,401 | 1,462 | 1,496 | 1,554 | 1,459 | 1,746 | 1,776 | 1,727 | 1,717 |
| 2009 | 1,640 | 1,742 | 1,825 | 1,864 | 1,926 | 1,683 | 1,628 | 1,685 | 1,781 | 1,856 | 1,821 | 2,223 |
| 2010 | 2,677 | 2,722 | 3,475 | 3,422 | 3,418 | 3,106 | 2,758 | 2,860 | 2,670 | 2,755 | 2,893 | 2,988 |
| 2011 | 3,390 | 3,922 | 3,981 | 3,910 | 4,293 | 4,214 | 3,443 | 3,946 | 3,539 | 3,558 | 3,762 | 3,551 |
| 2012 | 4,416 | 5,035 | 4,776 | 5,135 | 4,991 | 4,556 | 4,083 | 3,662 | 3,893 | 3,822 | 4,019 | 3,614 |
| 2013 | 3,688 | 3,697 | 3,446 | 3,444 | 3,515 | 3,359 | 4,017 | 3,756 | 3,545 | 3,653 | 4,078 | 4,216 |
| 2014 | 4,165 | 4,203 | 3,954 | 4,254 | 4,493 | 4,563 | 4,663 | 3,724 | 3,756 | 3,788 | 4,094 | 4,417 |
| 2015 | 4,710 | 4,979 | 5,158 | 4,949 | 4,796 | 4,434 | 4,435 | 4,697 | 4,949 | 4,499 | 4,982 | 5,484 |
| 2016 | 5,386 | 5,381 | 5,107 | 5,843 | 5,398 | 5,935 | 5,278 | 5,124 | 5,138 | 5,290 | 4,973 | 5,599 |
| 2017 | 6,434 | 5,847 | 6,797 | 6,392 | 5,692 | 5,865 | 5,598 | 5,251 | 5,550 | 5,452 | 5,596 | 5,355 |
| 2018 | 6,087 | 6,298 | 6,057 | 6,479 | 6,406 | 6,143 | 6,002 | 5,584 | 6,584 | 5,919 | 6,813 | 6,662 |
| 2019 | 7,958 | 7,311 | 6,346 | 6,670 | 6,482 | 5,920 | 6,073 | 6,573 | 6,614 | 6,360 | 6,178 | 5,552 |
| 2020 | 5,769 | 6,161 | 6,939 | 7,300 | 6,640 | 5,957 | 5,763 | 5,117 | 4,458 | 4,686 | 5,210 | 5,388 |
| 2021 | 6,150 | 6,562 | 6,470 | 6,420 | 5,477 | 5,241 | 5,407 | 4,320 | 4,646 | 4,681 | 5,032 | 5,558 |
| 2022 | 6,150 | 6,405 | 6,906 | 5,947 | 6,289 | 6,039 | 5,791 | 5,266 | 4,807 | 4,736 | 5,870 | 6,045 |
| 2023 | 6,365 | 6,705 | 6,969 | 6,552 | 6,210 | 5,630 | 5,726 | 5,853 | 5,776 | 5,328 | 6,246 | 6,542 |
| 2024 | 6,622 | 7,012 | 7,188 | 7,145 | ||||||||
| - = No Data Reported; -- = Not Applicable; NA = Not Available; W = Withheld to avoid disclosure of individual company data. |
| Release Date: 6/28/2024 |
| Next Release Date: 7/31/2024 |