|
Download Data (XLS File) |
|
||||||||
|
||||||||
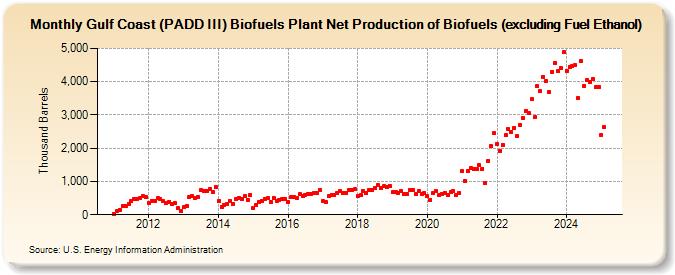
| Gulf Coast (PADD III) Biofuels Plant Net Production of Biofuels (excluding Fuel Ethanol) (Thousand Barrels) | ||||||||
| Year | Jan | Feb | Mar | Apr | May | Jun | Jul | Aug | Sep | Oct | Nov | Dec |
|---|---|---|---|---|---|---|---|---|---|---|---|---|
| 2011 | 34 | 101 | 152 | 247 | 262 | 330 | 406 | 467 | 469 | 513 | 553 | 538 |
| 2012 | 363 | 423 | 421 | 488 | 475 | 402 | 356 | 391 | 325 | 342 | 193 | 103 |
| 2013 | 224 | 277 | 524 | 558 | 499 | 533 | 742 | 716 | 726 | 758 | 688 | 820 |
| 2014 | 407 | 232 | 299 | 334 | 409 | 314 | 467 | 514 | 464 | 548 | 447 | 597 |
| 2015 | 208 | 281 | 372 | 426 | 484 | 493 | 396 | 509 | 416 | 456 | 472 | 474 |
| 2016 | 384 | 532 | 523 | 492 | 615 | 571 | 601 | 621 | 634 | 656 | 654 | 750 |
| 2017 | 404 | 371 | 555 | 605 | 593 | 650 | 707 | 664 | 643 | 748 | 735 | 760 |
| 2018 | 558 | 596 | 704 | 645 | 734 | 734 | 797 | 881 | 794 | 853 | 839 | 872 |
| 2019 | 670 | 677 | 650 | 715 | 622 | 619 | 743 | 745 | 620 | 698 | 611 | 653 |
| 2020 | 551 | 447 | 643 | 702 | 588 | 634 | 665 | 590 | 669 | 710 | 593 | 653 |
| 2021 | 1,314 | 1,005 | 1,319 | 1,402 | 1,371 | 1,361 | 1,480 | 1,388 | 966 | 1,625 | 2,057 | 2,444 |
| 2022 | 2,135 | 1,920 | 2,109 | 2,386 | 2,573 | 2,493 | 2,615 | 2,372 | 2,712 | 2,908 | 3,127 | 3,044 |
| 2023 | 3,466 | 2,925 | 3,855 | 3,715 | 4,149 | 4,014 | 3,686 | 4,356 | 4,575 | 4,310 | 4,410 | 4,882 |
| 2024 | 4,334 | |||||||||||
| - = No Data Reported; -- = Not Applicable; NA = Not Available; W = Withheld to avoid disclosure of individual company data. |
| Release Date: 3/29/2024 |
| Next Release Date: 4/30/2024 |