|
Download Data (XLS File) |
|
||||||||
|
||||||||
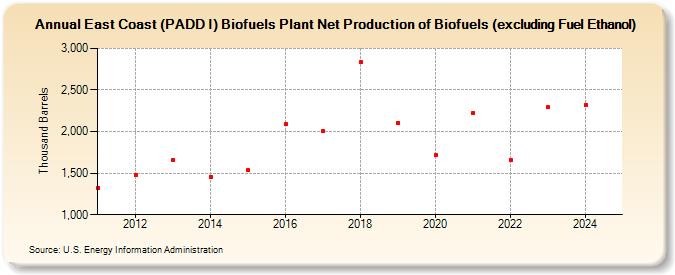
| East Coast (PADD I) Biofuels Plant Net Production of Biofuels (excluding Fuel Ethanol) (Thousand Barrels) | ||||||||
| Decade | Year-0 | Year-1 | Year-2 | Year-3 | Year-4 | Year-5 | Year-6 | Year-7 | Year-8 | Year-9 |
|---|---|---|---|---|---|---|---|---|---|---|
| 2010's | 1,322 | 1,472 | 1,660 | 1,458 | 1,534 | 2,086 | 2,008 | 2,835 | 2,104 | |
| 2020's | 1,715 | 2,226 | 1,663 | 2,291 |
| - = No Data Reported; -- = Not Applicable; NA = Not Available; W = Withheld to avoid disclosure of individual company data. |
| Release Date: 8/30/2024 |
| Next Release Date: 8/29/2025 |