|
Download Data (XLS File) |
|
||||||||
|
||||||||
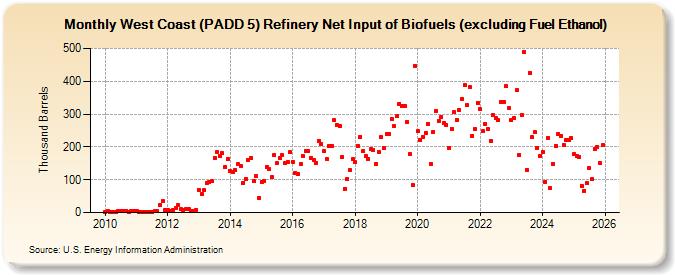
| West Coast (PADD 5) Refinery Net Input of Biofuels (excluding Fuel Ethanol) (Thousand Barrels) | ||||||||
| Year | Jan | Feb | Mar | Apr | May | Jun | Jul | Aug | Sep | Oct | Nov | Dec |
|---|---|---|---|---|---|---|---|---|---|---|---|---|
| 2010 | 1 | 4 | 2 | 2 | 2 | 5 | 5 | 6 | 6 | 3 | 5 | 5 |
| 2011 | 5 | 1 | 2 | 2 | 3 | 3 | 3 | 4 | 4 | 24 | 35 | 8 |
| 2012 | 7 | 5 | 9 | 13 | 22 | 10 | 8 | 10 | 10 | 5 | 5 | 9 |
| 2013 | 70 | 58 | 68 | 91 | 92 | 95 | 167 | 183 | 172 | 181 | 138 | 163 |
| 2014 | 127 | 125 | 129 | 148 | 141 | 91 | 102 | 160 | 167 | 95 | 110 | 44 |
| 2015 | 92 | 96 | 139 | 132 | 108 | 176 | 150 | 166 | 174 | 151 | 154 | 183 |
| 2016 | 155 | 120 | 118 | 147 | 173 | 188 | 187 | 167 | 161 | 152 | 219 | 209 |
| 2017 | 186 | 163 | 204 | 202 | 281 | 268 | 263 | 169 | 73 | 102 | 129 | 163 |
| 2018 | 153 | 204 | 231 | 186 | 171 | 164 | 193 | 192 | 149 | 184 | 229 | 198 |
| 2019 | 238 | 239 | 285 | 265 | 293 | 332 | 324 | 324 | 276 | 179 | 83 | 447 |
| 2020 | 247 | 220 | 231 | 243 | 269 | 148 | 246 | 310 | 280 | 291 | 273 | 267 |
| 2021 | 198 | 256 | 306 | 283 | 313 | 346 | 389 | 328 | 383 | 234 | 255 | 335 |
| 2022 | 315 | 247 | 270 | 255 | 219 | 297 | 289 | 281 | 337 | 337 | 384 | 317 |
| 2023 | 281 | 287 | 372 | 176 | 296 | 489 | 130 | 426 | 357 | 237 | 185 | 160 |
| 2024 | 169 | |||||||||||
| - = No Data Reported; -- = Not Applicable; NA = Not Available; W = Withheld to avoid disclosure of individual company data. |
| Release Date: 3/29/2024 |
| Next Release Date: 4/30/2024 |