|
Download Data (XLS File) |
|
||||||||
|
||||||||
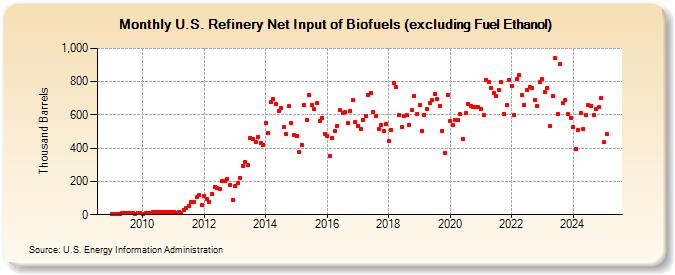
| U.S. Refinery Net Input of Biofuels (excluding Fuel Ethanol) (Thousand Barrels) | ||||||||
| Year | Jan | Feb | Mar | Apr | May | Jun | Jul | Aug | Sep | Oct | Nov | Dec |
|---|---|---|---|---|---|---|---|---|---|---|---|---|
| 2009 | 4 | 4 | 3 | 6 | 8 | 10 | 8 | 8 | 8 | 7 | 11 | 10 |
| 2010 | 7 | 10 | 9 | 10 | 14 | 19 | 19 | 16 | 18 | 19 | 18 | 16 |
| 2011 | 16 | 13 | 14 | 13 | 30 | 41 | 54 | 74 | 78 | 104 | 119 | 57 |
| 2012 | 115 | 95 | 77 | 126 | 168 | 159 | 156 | 202 | 202 | 213 | 179 | 91 |
| 2013 | 172 | 188 | 223 | 294 | 318 | 301 | 463 | 454 | 435 | 470 | 432 | 422 |
| 2014 | 550 | 494 | 675 | 693 | 665 | 622 | 641 | 526 | 484 | 652 | 553 | 479 |
| 2015 | 476 | 379 | 421 | 659 | 570 | 721 | 662 | 633 | 670 | 564 | 582 | 488 |
| 2016 | 476 | 355 | 460 | 501 | 534 | 627 | 609 | 618 | 552 | 626 | 687 | 560 |
| 2017 | 536 | 513 | 572 | 595 | 719 | 733 | 620 | 596 | 518 | 540 | 504 | 548 |
| 2018 | 443 | 509 | 790 | 767 | 602 | 527 | 595 | 600 | 542 | 628 | 714 | 608 |
| 2019 | 660 | 504 | 602 | 637 | 670 | 689 | 725 | 696 | 655 | 506 | 371 | 722 |
| 2020 | 564 | 537 | 568 | 568 | 604 | 456 | 612 | 664 | 656 | 649 | 650 | 645 |
| 2021 | 637 | 598 | 812 | 795 | 761 | 734 | 712 | 750 | 797 | 606 | 657 | 812 |
| 2022 | 775 | 602 | 813 | 838 | 717 | 660 | 748 | 766 | 762 | 688 | 655 | 796 |
| 2023 | 787 | 733 | 764 | 533 | 714 | 943 | 607 | 888 | 796 | 682 | 592 | 570 |
| 2024 | 529 | |||||||||||
| - = No Data Reported; -- = Not Applicable; NA = Not Available; W = Withheld to avoid disclosure of individual company data. |
| Release Date: 3/29/2024 |
| Next Release Date: 4/30/2024 |